Usage Information
Warning: DO NOT OVER INFLATE the pressure cuff. Severe damage to major blood vessels, capillaries, and nerves is possible. Never exceed an inflation pressure in excess of 30 mmHg over expected systolic pressure. For an average teenager, a systolic pressure of 110 mmHg is expected.
The pressure cuff must be inflated to at least 110 mmHg for the readings to be taken correctly.
Read the operating instructions carefully before use.
The cuff supplied is a universal cuff. When wrapped around the arm it should be tight before inflation, but not so tight that it is already creating restrictions of blood flow. We have found that the Velcro can be stiff and restrict the cuff, use the minimal Velcro overlap to be consistent with the cuff staying in position.
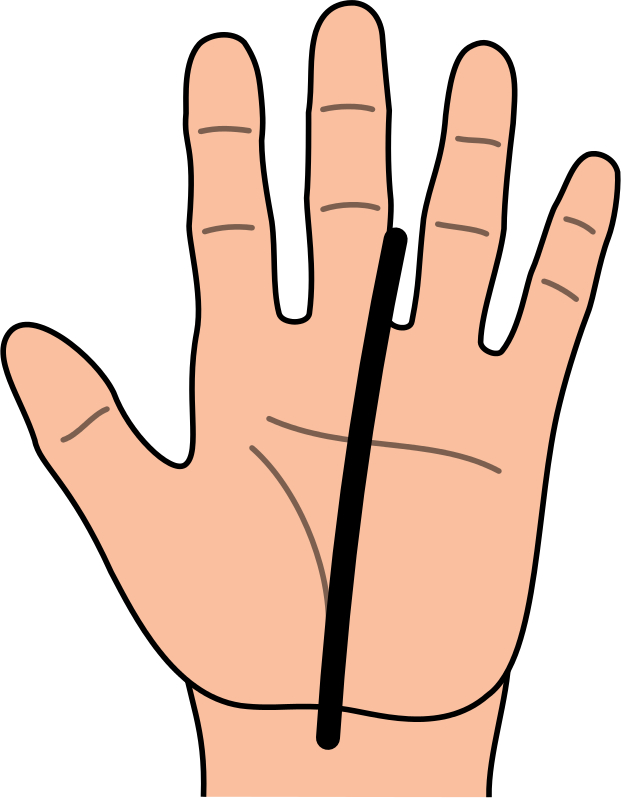
The position of the cuff is critical to getting consistent readings, the cuff has several markers on to help with alignment. Position the cuff so that the tube labelled “Left arm” is over the brachial artery – this is best estimated by running the tube from the cuff labelled “left arm” down the arm (with the arm orientated to give the palm up) to the space between the ring and middle finger.
The cuff should have a space equivalent to two fingers between the lower arm and the lower edge of the cuff. When you have our arm in the correct collection position the lower edge of the cuff should not be touching the lower arm (ideal).
Positioning the cuff is really a two-person job.
When sharing a pressure cuff, it is good practice to clean the surface of the cuff that contacts the skin between measurements. Alternatively, clean the skin contact area before and after use.
The sensor is not waterproof. It may be cleaned using a damp cloth. Do not immerse in water or detergent. Do not place the sensor in an environment in which high humidity levels are possible as this may result in damage or malfunction.
Blood pressure instructions:
While taking blood pressure can be an individual process, it is easier to have the assistance of another person.
For all blood pressure measurements, to get the most accurate results it is important to have the user sit down for a few minutes before having their blood pressure taken. They must be resting and not move during the measurement process.
All readings from this apparatus are indicative and not absolute; the apparatus is not medical grade or certified.
Blood pressure readings can be determined in EasySense by two methods. Automated where all the calculations are conducted without user intervention, and Manual where the raw data is shown and the user calculates the data.
Automated approach:
- Attach the tube from the cuff to the Blood Pressure Sensor
- Position the cuff on arm:
- Ensure the cuff is fully deflated. Open the valve on the pump bulb slightly if air needs to escape.
- Make sure you have minimal clothing over the arm to be used (for example shirt sleeve only not shirt and jumper). Some improvement will be seen if the cuff is placed directly to skin.
- Wrap the cuff around the arm so the middle of the cuff is over the brachial artery. You may need assistance for this.
- Position the cuff approximately 2.5 cm above the elbow with the arrow on the cuff above the brachial artery.
- Close the valve.
- Turn on the Wireless Blood Pressure sensor and connect the blood pressure sensor to EasySense.
- By default, the following ranges are turned on - this is what you need for the automated blood pressure method: See image 1.0 below.
- In EasySense, change the layout to two charts. On the top left of one of the new charts, click on the "?" symbol and select "BP".
- EasySense will default the recording setup to an interval of 50 ms and Continuous Mode.
- Start recording in EasySense.
- Pump up the cuff (approximately one to two big pumps per second) until the cuff pressure is approximately 140 to 150 mmHg. The cuff pressure is shown on the graph and the number box on the far right-hand side of EasySense.
- Slowly open the valve to decrease the cuff pressure. This will require a very small turn of the valve in the region of 5 to 10 degrees. The cuff should deflate at a rate of 5 to 10mmHg every 5 seconds or so, use the graph display to check the rate of deflation.
- The experiment will automatically end once the cuff pressure gets below 35 mmHg. The blood pressure results will then be displayed in the ‘BP’ chart as shown below: See image 1.1 below.
- Multiple runs can be performed by simply pressing Start again.
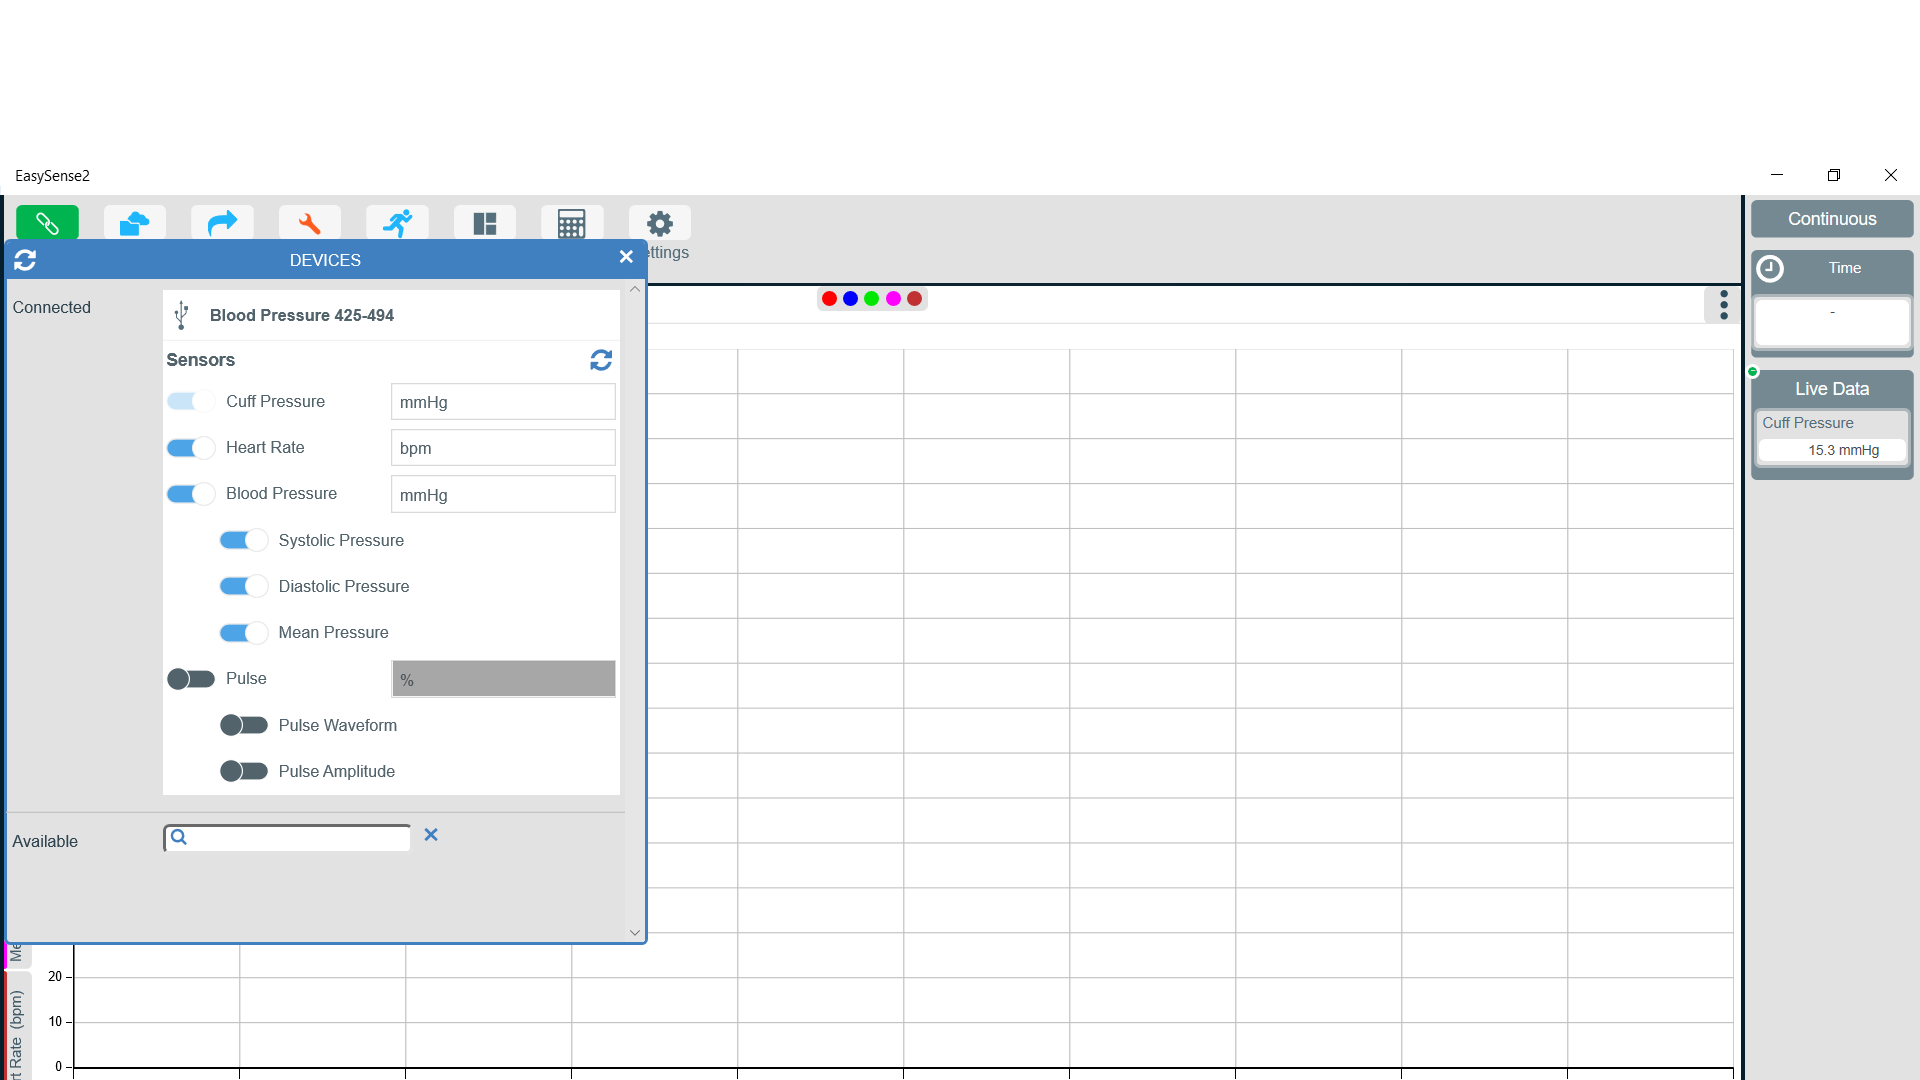
Image 1.0
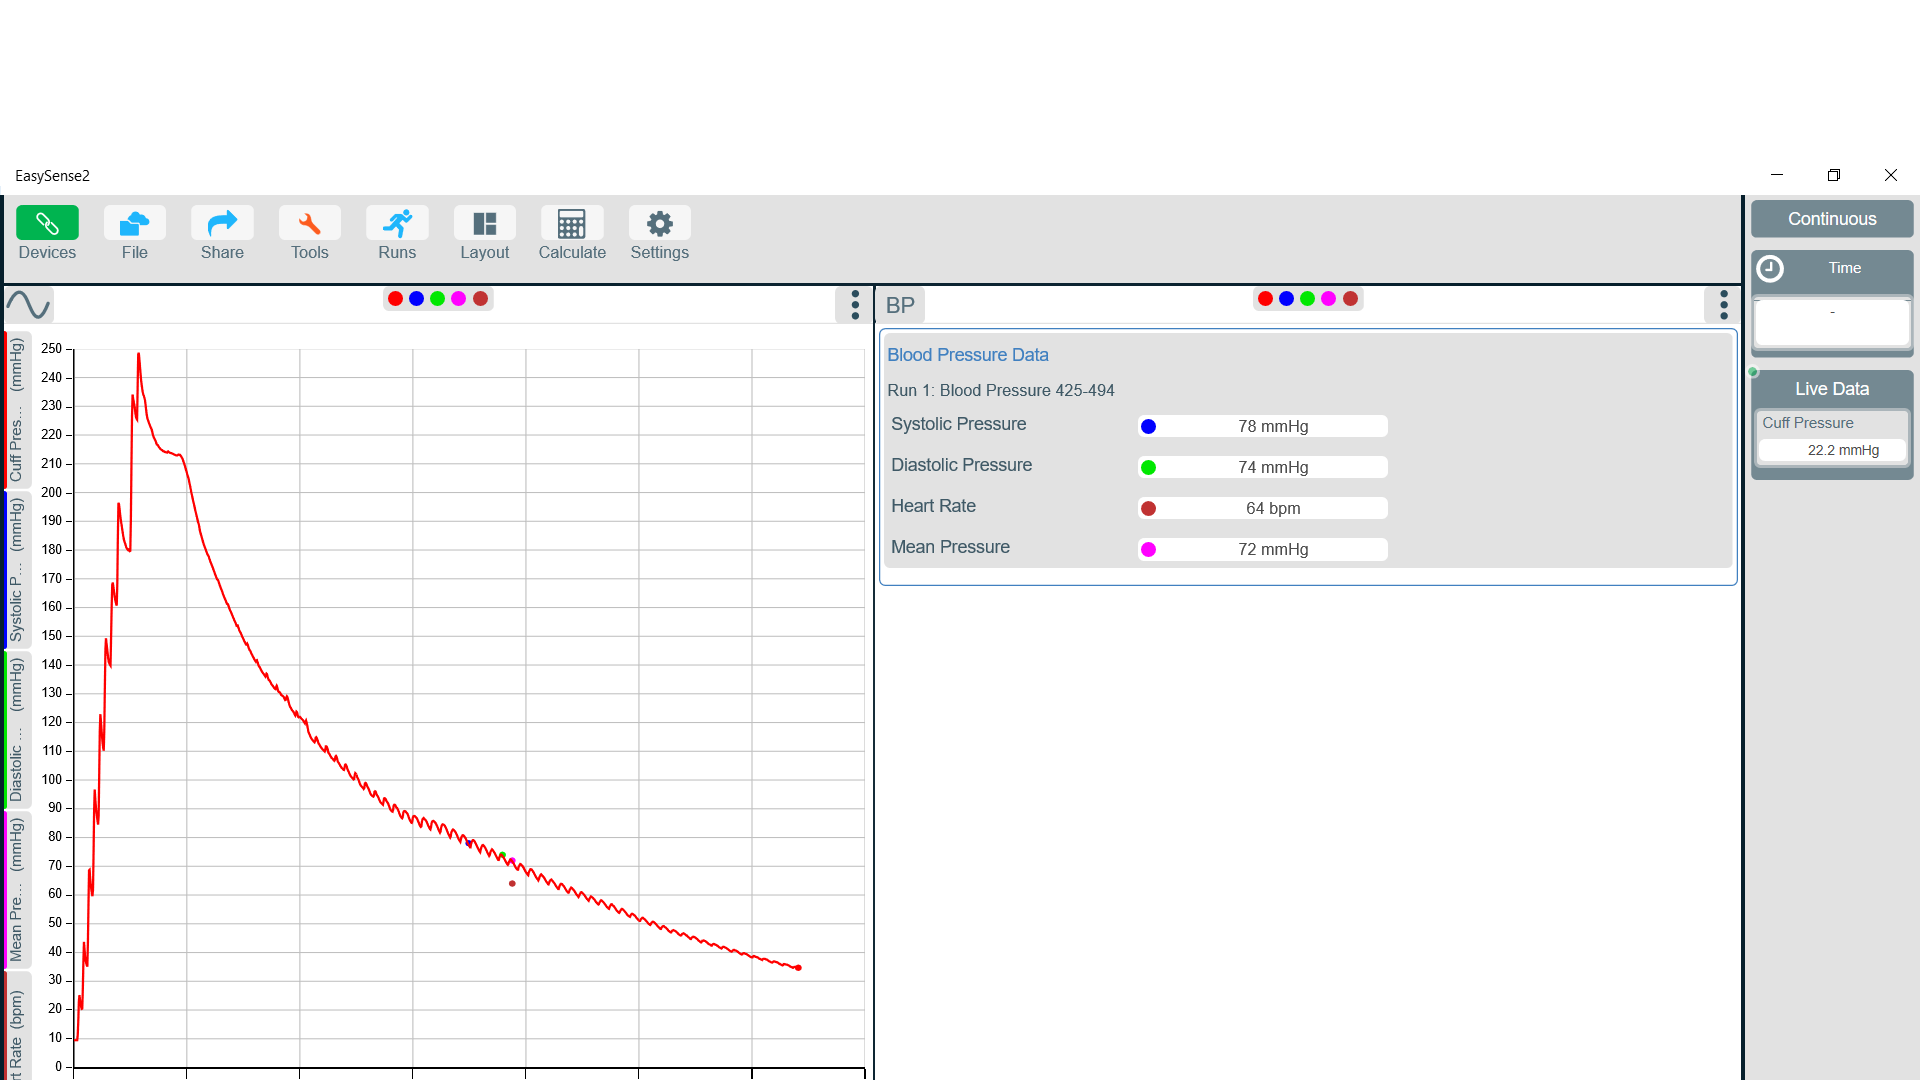
Image 1.1
Manual approach (gives an understanding of how an automated blood pressure monitor works):
- Follow instructions form the Automated section for fitting the cuff and installing the sensor.
- Connect the Blood Pressure Sensor to EasySense.
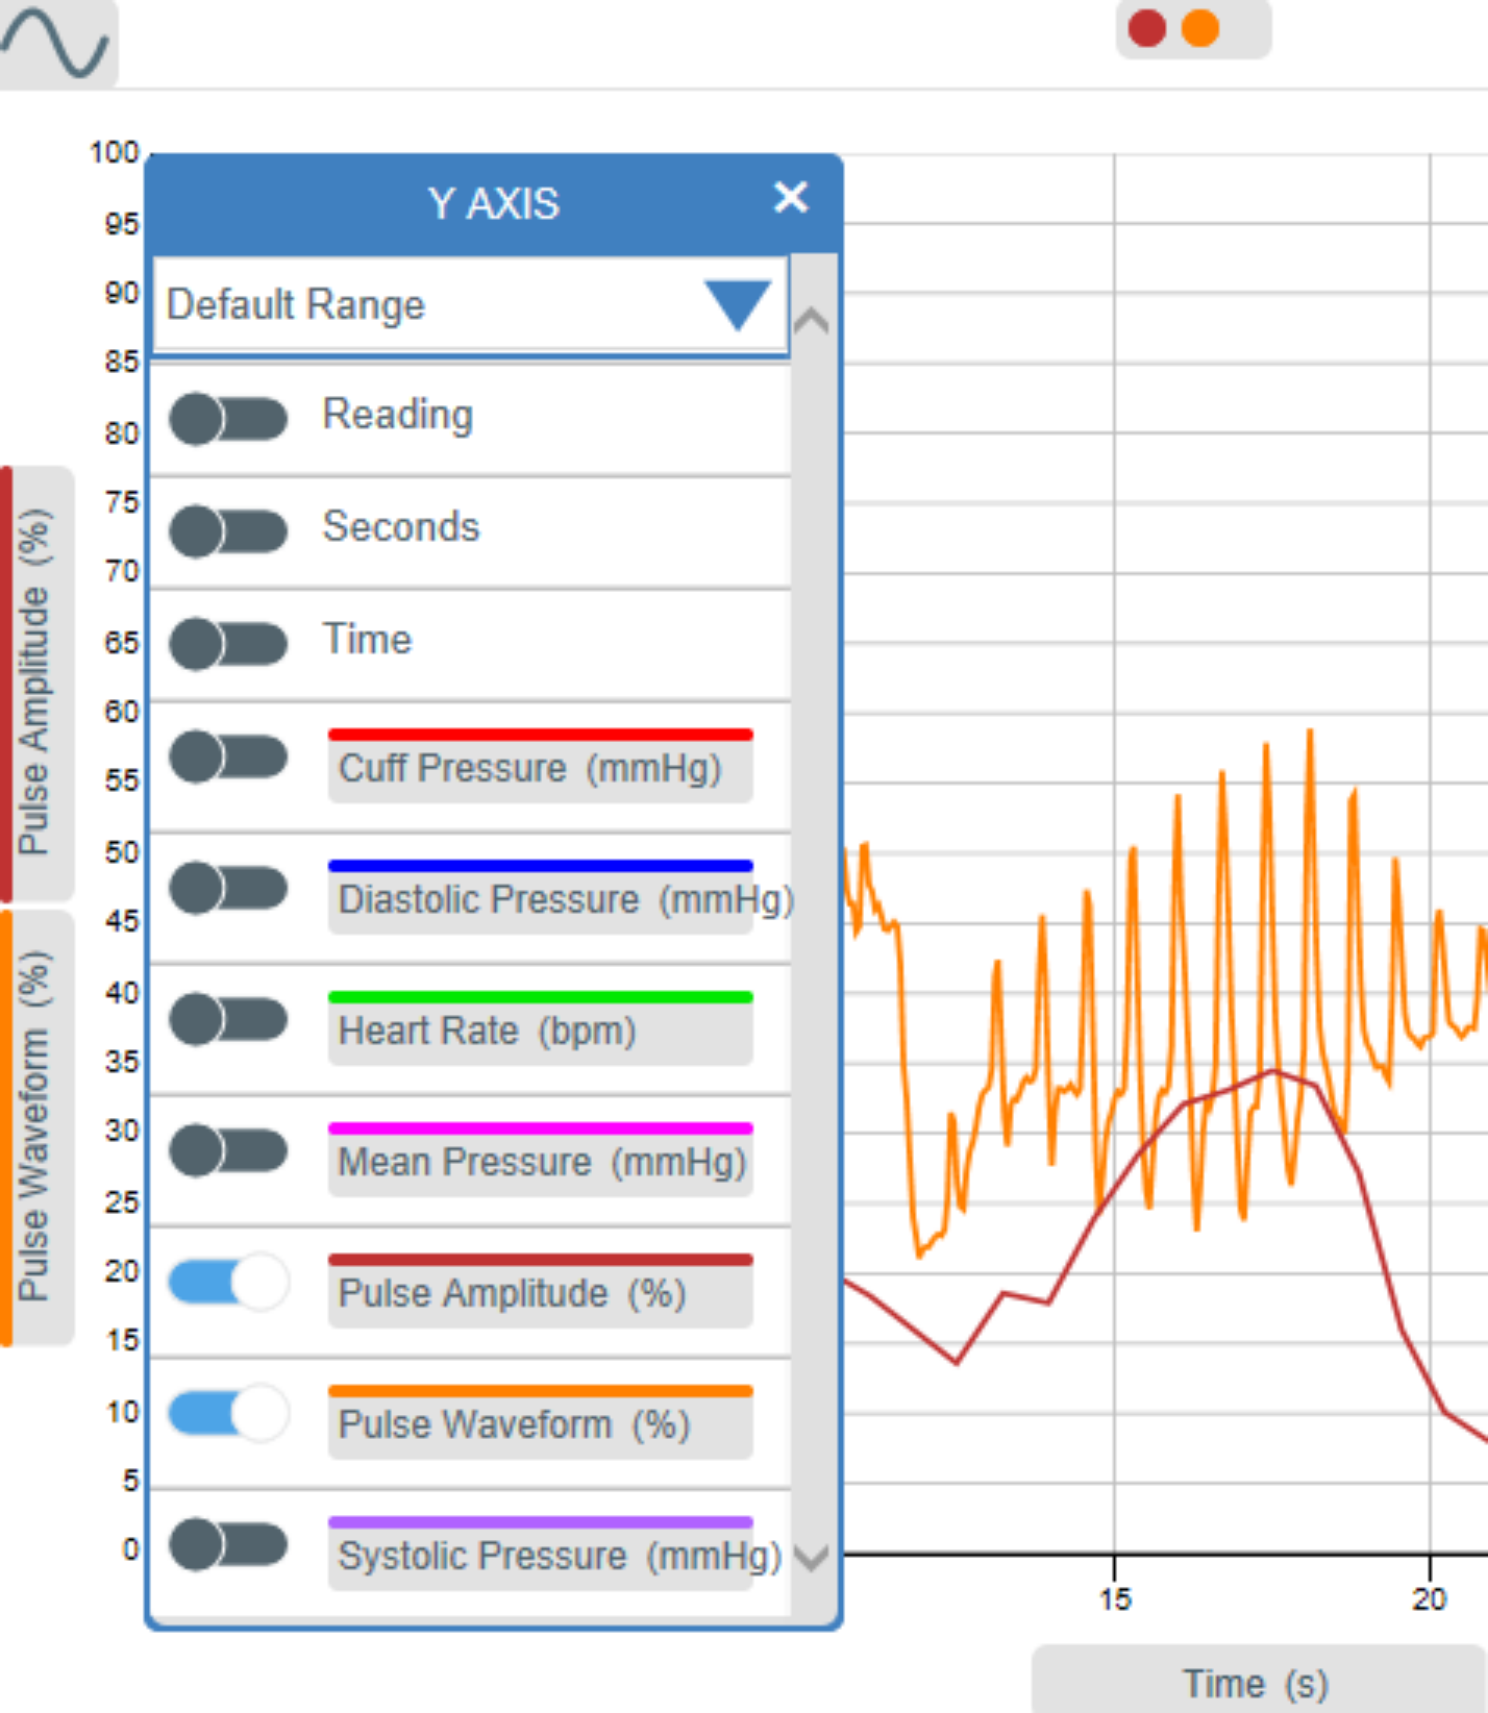
- In Devices, turn on both pulse ranges in the devices menu. The Blood pressure and Heart Rate ranges should be turned off. See image 2.0 below.
- The default setting of EasySense for a single panel with a graph is required.
- EasySense will default the recording setup to an interval of 50 ms and Continuous Mode. For this experiment, it is best to use setup to change the sampling interval to 10ms although it will still work at the 50 ms default.
- Start recording in EasySense.
- Pump up the cuff (approximately one to two big pumps per second) until the cuff pressure is approximately 140 to 150 mmHg. The cuff pressure is shown on the graph and the number box on the far righthand side of EasySense.
- Slowly open the valve to decrease the cuff pressure. This will require a very small turn of the valve in the region of 5 to 10 degrees. The cuff should deflate at a rate of 5 to 10mmHg every 5 seconds or so.
- The experiment will automatically end once the cuff pressure gets to below 35mmHg. Results similar to those below will be recorded: See image 2.1 below.
- Use the Data Selection tool (Tools -> Select Data) to select just the portion when the green ‘Pulse Amplitude’ data is plotted – i.e. between about 10 s and 50 s. See image 2.2 below.
- Meaning of the signals:
- RED = Cuff pressure. This shows the small bumps of the pulse caused by the blood flow returning to the arm.
- BLUE = Pulse Waveform. This is an amplified version of just the bumps from the cuff pressure that shows more detail of the pulse and heart beats.
- GREEN = Pulse Amplitude. This is the amplitude of the Pulse Waveform (i.e. from min to max).
- Data analysis:
- Use the Crosshair values tool to find the maximum point on the Pulse Amplitude signal. Once this is found, record this value (in the above example this is approximately 31 read off the Y-axis for the green trace) and read off the corresponding Pressure from the Cuff Pressure signal. This is known as the Mean Pressure (also known as the Mean Arterial Pressure or MAP). In this example the Mean Pressure is approximately 104mmHg.
- Systolic Pressure – This is calculated as a percentage of the peak value of the Pulse Amplitude trace. Typical values for the Systolic percentage are between 55% to 70%. Each Blood pressure monitor has a different measurement method and derived percentage. Calculate the Systolic percentage of the Pulse Amplitude signal, use the Crosshair values tool to find this value to the left of the peak on the Pulse Amplitude trace and again read off the actual pressure at this point on the Cuff Pressure trace – this is the Systolic Pressure.
- Example: If the max value of the green Pulse Amplitude trace is 31 and I use 70% as the Systolic percentage, then 0.70*31 = 21.7 -> find this value on the green trace to the left of the max value on pulse amplitude and read off the corresponding red Cuff Pressure at this point – in this example this equates to 128mmHg.
- Diastolic Pressure – this follows the same approach as Systolic. The typical percentage range for Diastolic Pressure is 70 to 85% of the peak Pulse Amplitude. Calculate the Diastolic percentage and find this point to the right of peak on the Pulse Amplitude trace. Again, read off the cuff pressure at the point -this is the Diastolic Pressure.
- Example: 75% of 31 = 23.25. This equates to a cuff pressure of 81 mmHg
- You will now have the Systolic/Diastolic values that are associated with Blood pressure readings. For the above example this is 128 / 81.
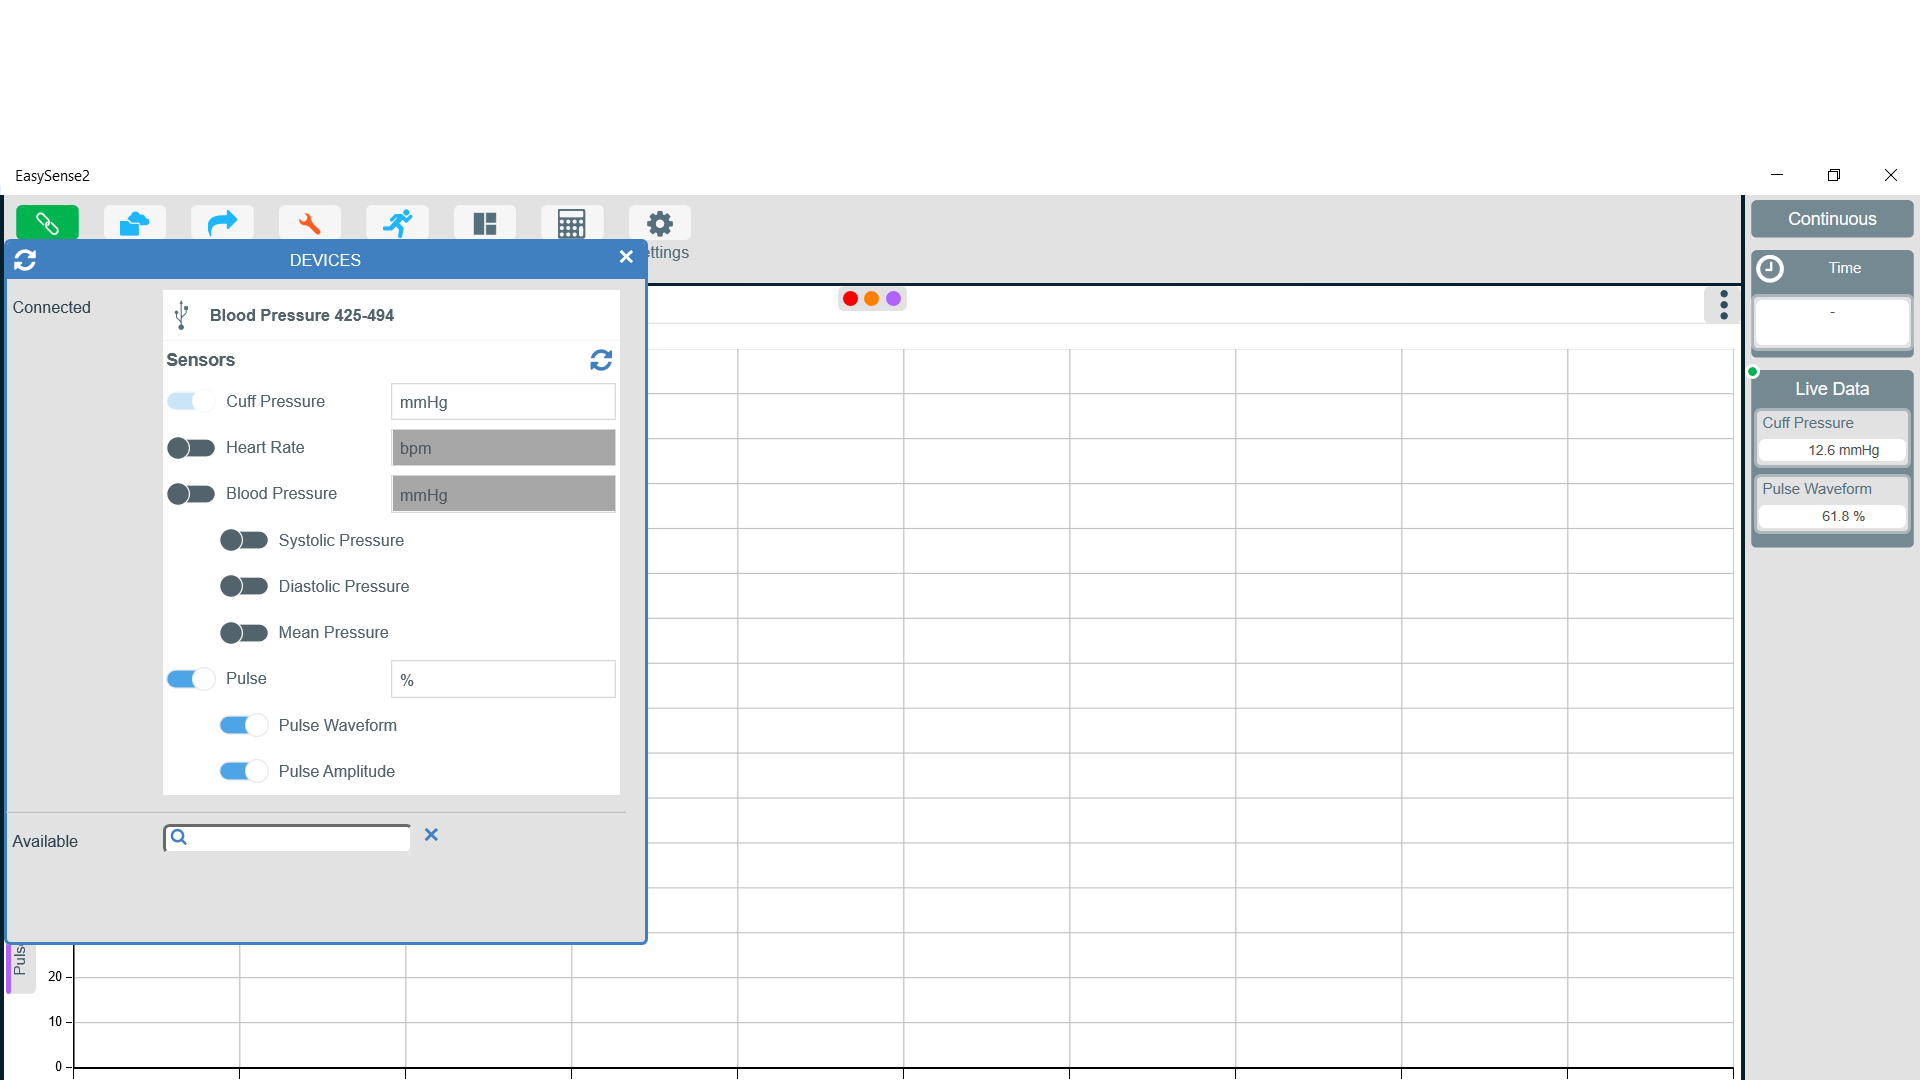
Image 2.0
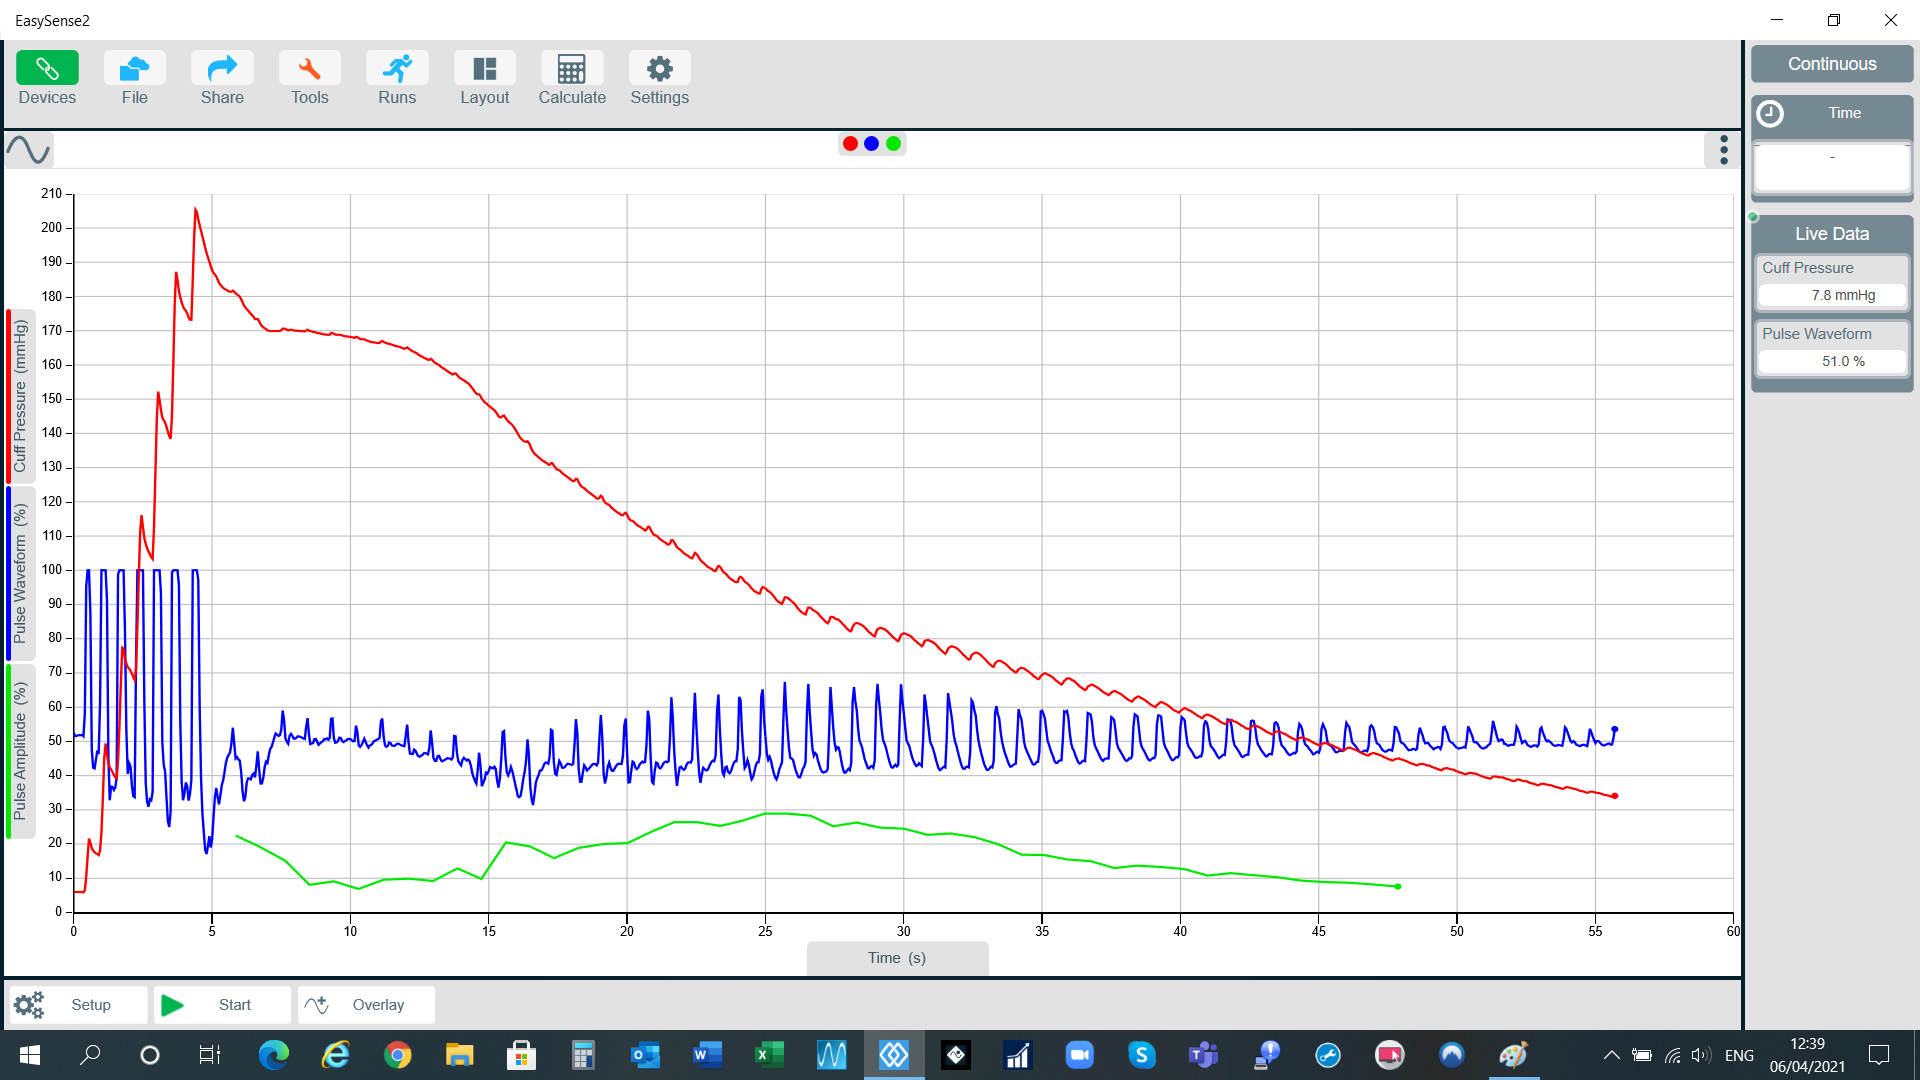
Image 2.1
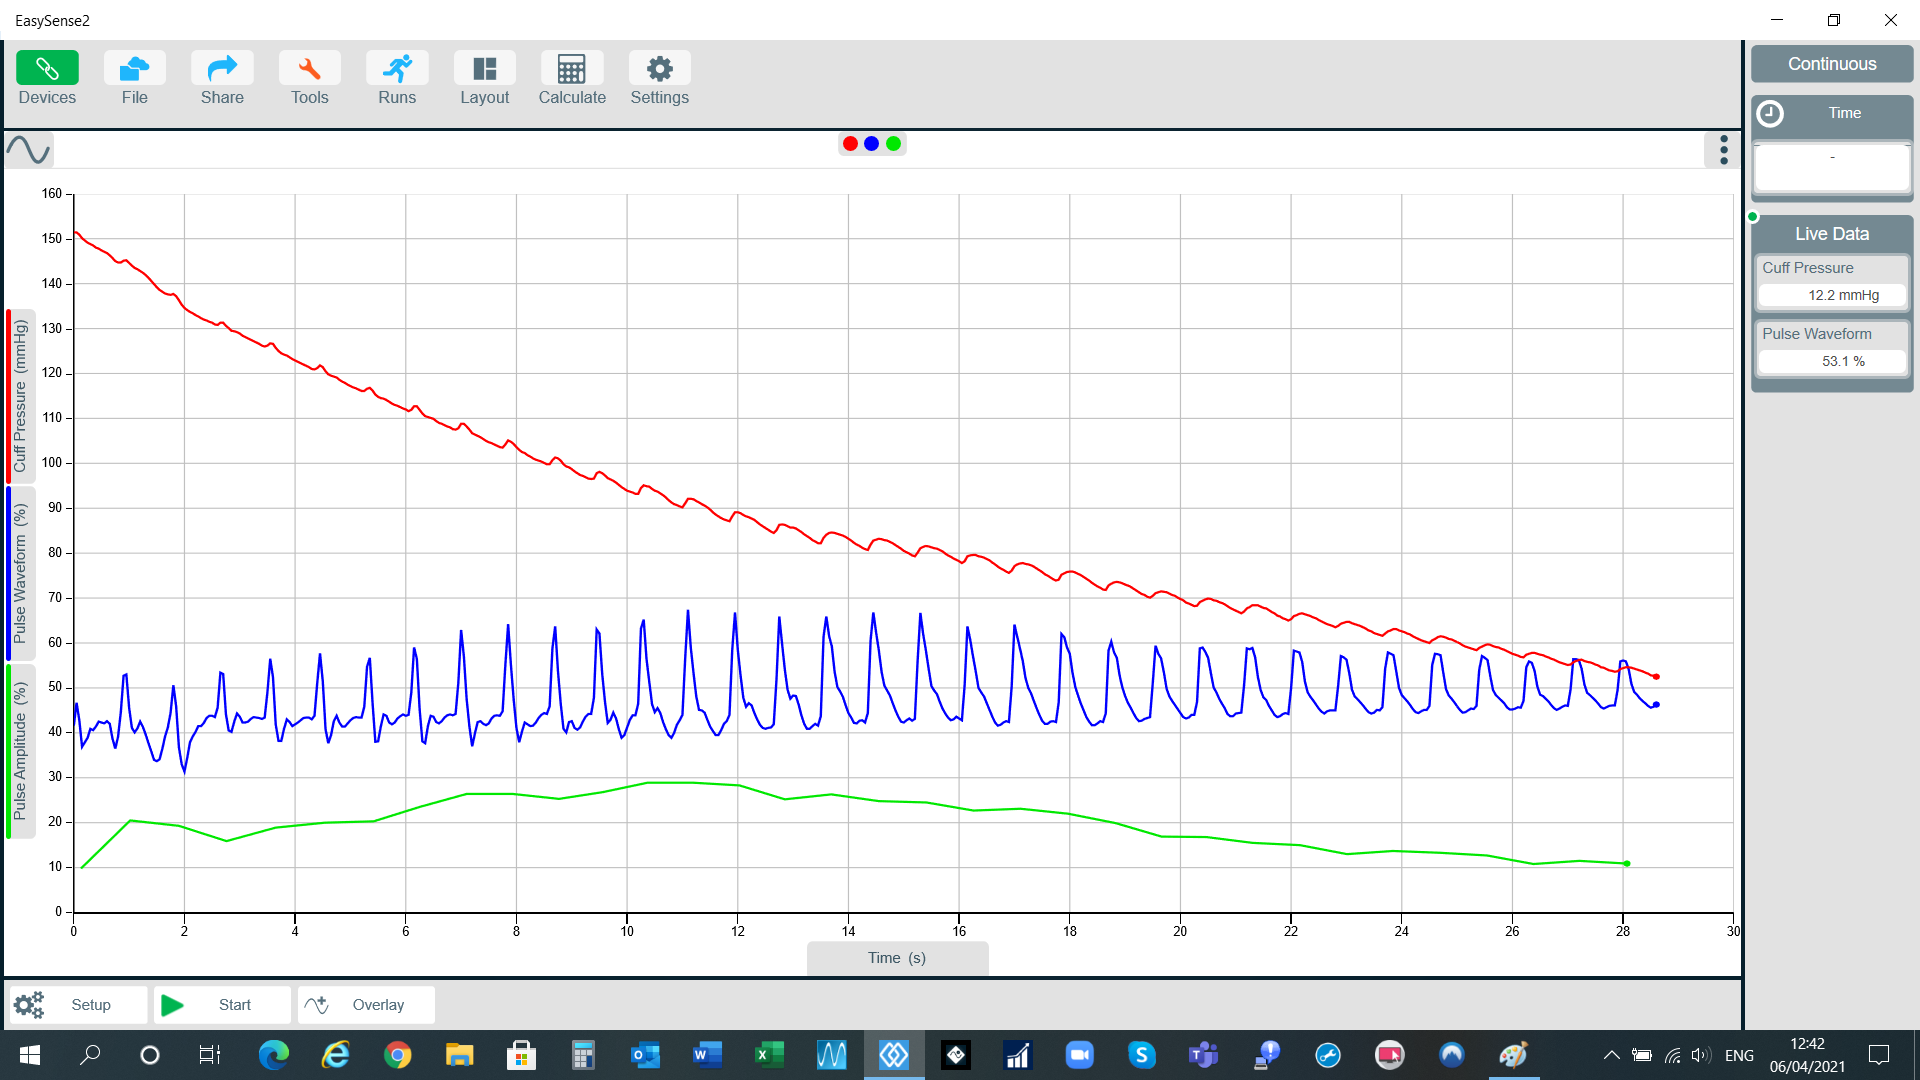
Image 2.2
The traditional approach:
- An analogue pressure gauge is also included with Blood Pressure kit. This can be attached to the cuff instead of the Blood Pressure sensor. By using an additional Stethoscope (product code 3178) and listening for the Korotkoff sounds whilst deflating the cuff, blood pressure values can be determined. You can use the data from the Blood Pressure sensor to confirm the auditory signal. This is how a doctor traditionally performs blood pressure readings if not using an automated system.
- This approach just requires a graph.
- EasySense will default the recording setup to an interval of 50 ms and Continuous Mode. For this experiment it is best to change the sampling interval to 10 ms although it will still work at the 50 ms default.
- Start recording in EasySense.
- Pump up the cuff (approximately one to two big pumps per second) until the cuff pressure is approximately 170 to 180mmHg. The cuff pressure is shown on the graph and the number box on the far right-hand side of EasySense.
- Slowly open the valve to decrease the cuff pressure. This will require a very small turn of the valve in the region of 5 to 10 degrees. The cuff should deflate at a rate of 5 to 10mmHg every 5 seconds or so.
- The experiment will automatically end once the cuff pressure gets to below 35 mmHg. Results similar to those below will be recorded:
Additional Help & Guidance
Sometimes, despite your best attempts the BP will not be giving a sensible value. This is almost certainly down to technique; the following information can help you diagnose why results are erratic.
The BP calculation listens for a period of quiet after the deflation starts and then waits for “noise” in the form of a pulsed pressure wave; if you introduce noise into the period after you start deflation of the cuff the algorithm will get a false start. Typically, you would notice diastolic and systolic data being very similar or even the systolic reading higher than the diastolic – which is plainly not true.
Try the following:
- Connect the BP sensor by a good long USB cable to a PC (preferred).
- Open the software; the USB connection will automatically connect the sensor to the software.
- In devices, turn on the item called Pulse.
- Use the Layout (top centre of icons) and select two panels one on top of the other.
- Make the top Panel the BP.
- Make the lower panel graph. On this one, turn off everything except Pulse Waveform.
- Click start, pump up the cuff to about 160 mmHg, use the live data boxes to the right to view.
- Unscrew the silver thumb screw. Do not move or joggle the pump. Watch the Pulse; you are looking to get a graphical pattern to data as shown below.
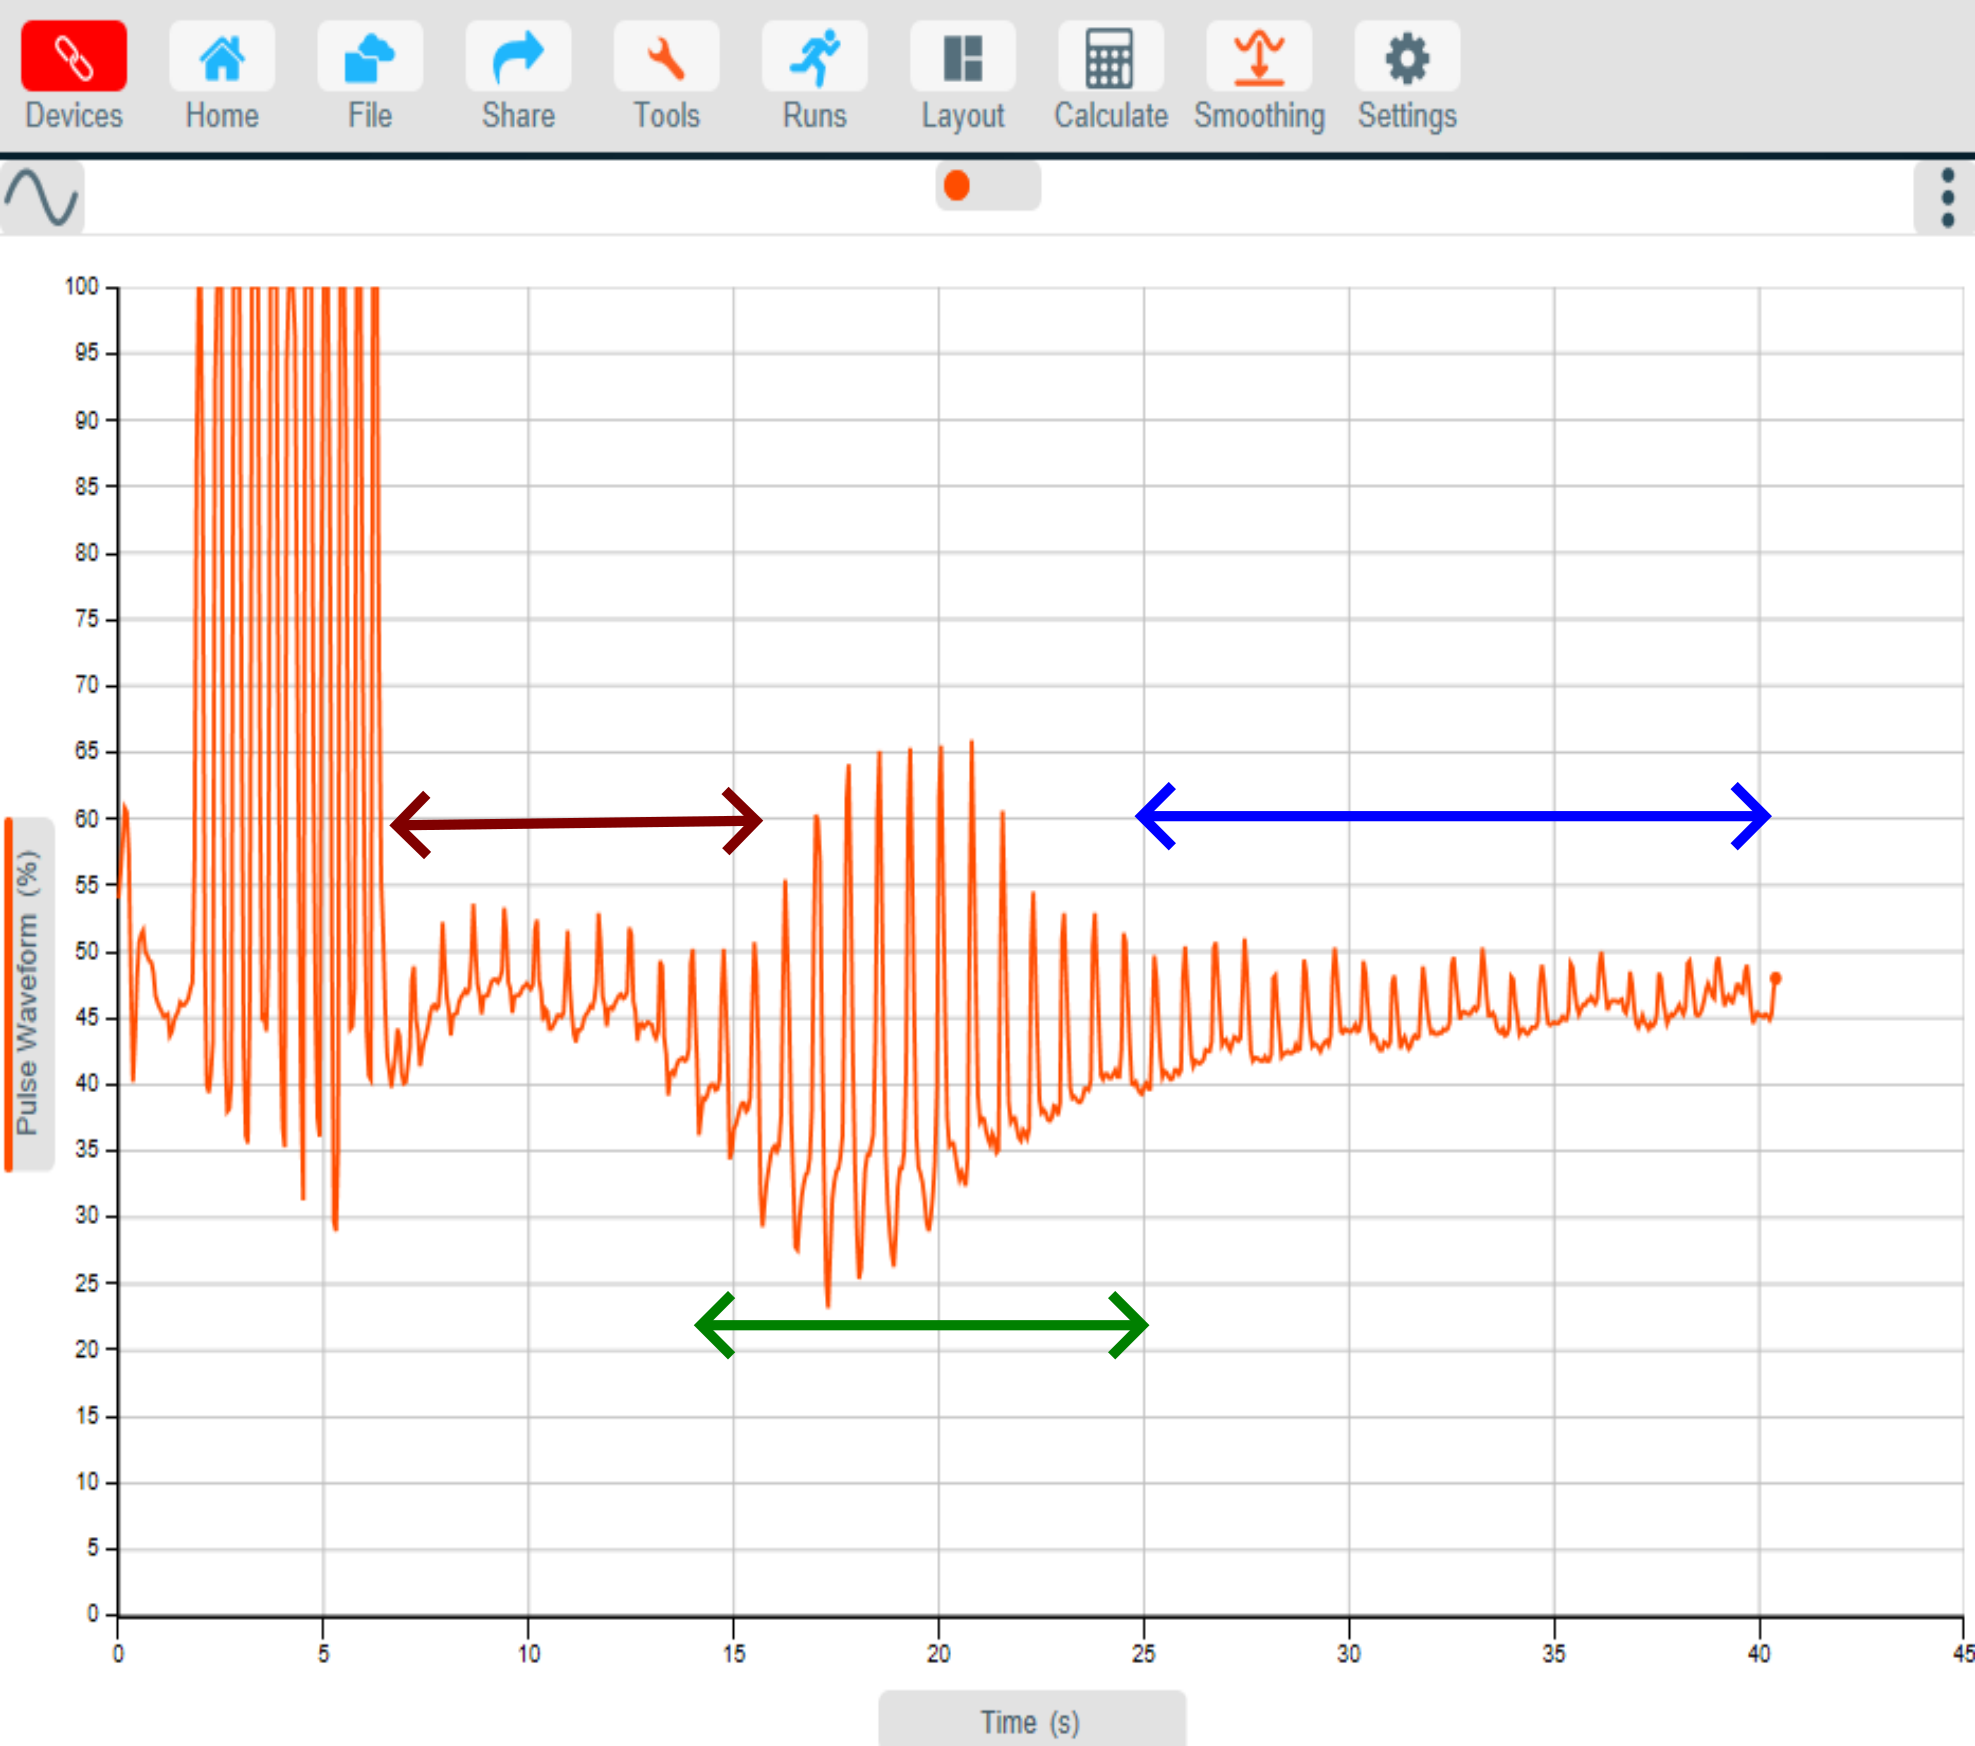
The annotations indicate the areas of a good set of data.
Red = a clean, “even” set of pulses immediately after the tall inflation pulses.
Green = the change in pulse amplitude the algorithm that produces the BP is looking for.
Blue = the “normal pulse” being recorded by changes in the cuff pressure, you can fully deflate the cuff at this point.
The recording below shows a “bad set of data”.
The section ringed shows how a large pressure artefact has been created – in this case it was by dropping the pressure bulb onto the tabletop; it could equally be created by;
- Wiggling the fingers
- Flexing the hand
- Holding onto to the pump bulb
- Changing position of the arm and changing the pressure in the cuff
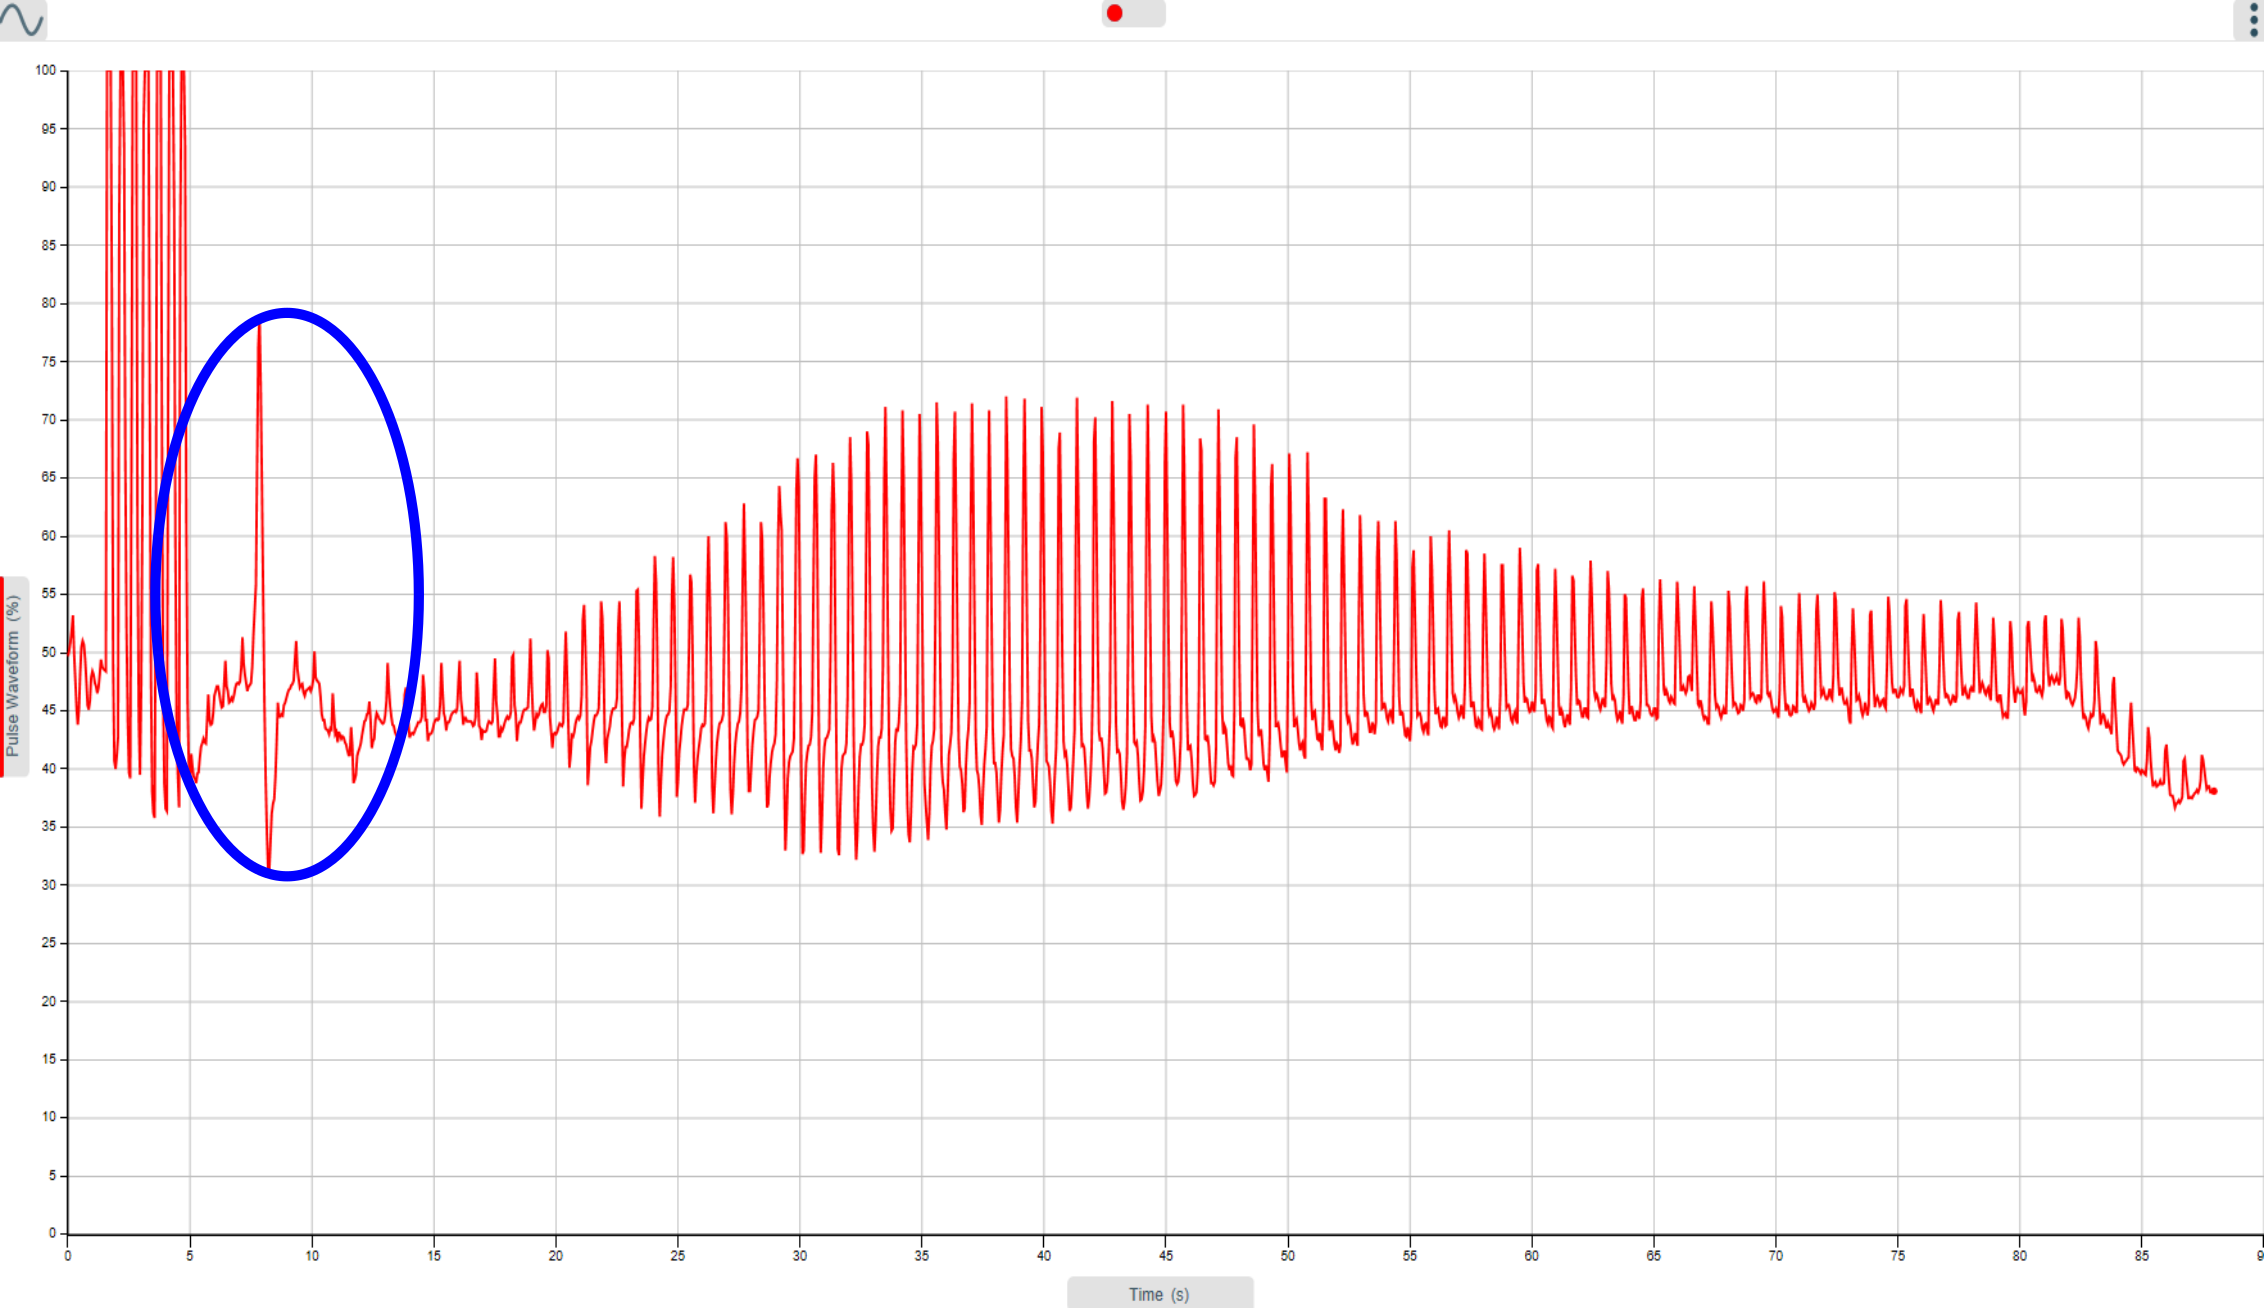
The large pressure peak will trigger the BP algorithm, in this case looking at the BP data panel you will see that the Systolic pressure has not been recorded.
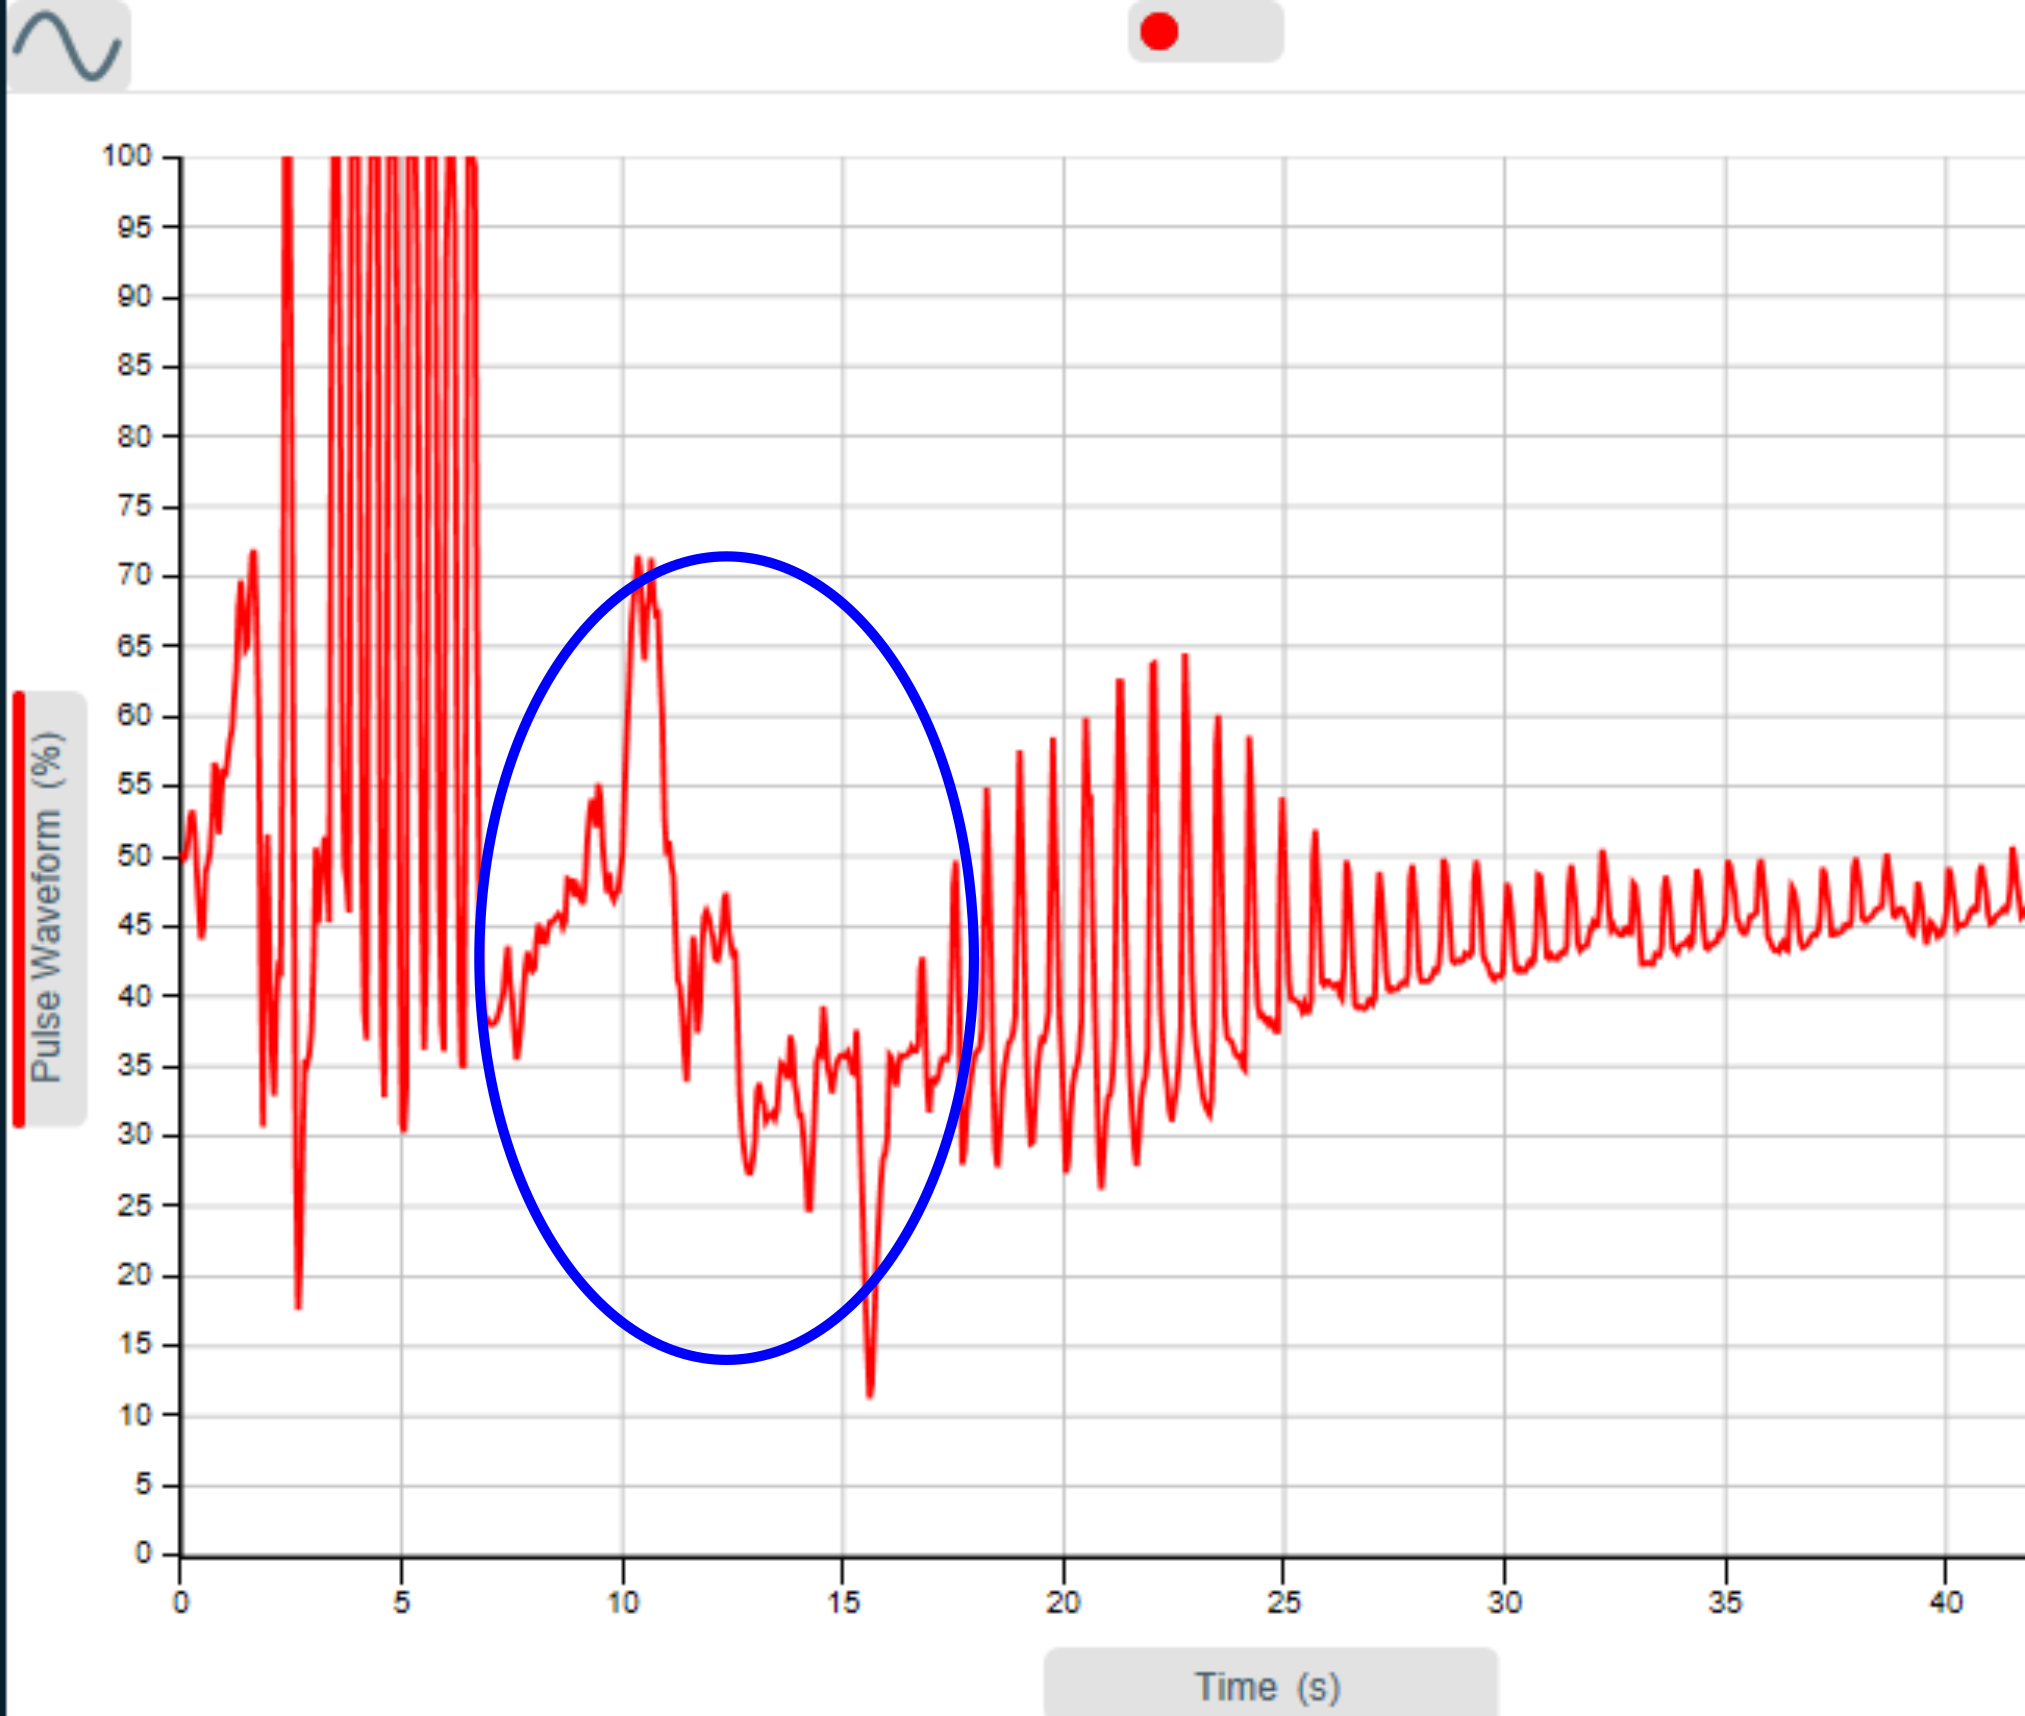
In this example the many pressure peaks in the period ringed have prevented any meaningful values (diastolic and systolic data are virtually the same).
Normally you will find after a few attempts that you will quickly develop a good collection protocol and you will be able to remove the graphical representation of the data. This is not unusual – use of BP meters is not just a simply matter of placing the cuff, inflating, and getting an answer – it does require a period of training and understanding why you may not get results.
Note:
The sensor collects data independently of the software – the software is just a view into the data.
The sensor stores the data within the sensor. At your chosen inter-sample period, values are sent to the software to view in graph – this is why BP suddenly appears. The calculation in the sensor derives the value and sends back BP once;
- Cuff pressure has Fallen below (approx.) 35 mmHG
- The data store is full – this is about 90 seconds after start.
- If there has been a long pump-up time to too high a pressure the sensor memory store will fill quicker.
So, in summary, quick inflate, good steady deflate, no movement of the bulb or you.