Usage Information
The interest in recording heart sounds potentially dates back to Robert Hooke (1635-1703), who wrote: "There may also be a possibility of discovering the internal motions and actions of bodies - whether animal, vegetable, or mineral, by the sound they make". The earliest known recordings date back to the early nineteenth century.
The heart has phases of filling and pumping, distributed across arterial and ventricular activity. These are denoted as systole and diastole and are represented below. These are intricately linked to ECG patterns (P, Q, R, S, T): ventricular systole occurs at the "RT interval", diastole during the "TR interval"; arterial systole occurs in the "PR interval" and diastole in the period defined by "RP".
The heart sound may be recorded and produce a phonocardiogram; the key instrument for that is a digital stethoscope.
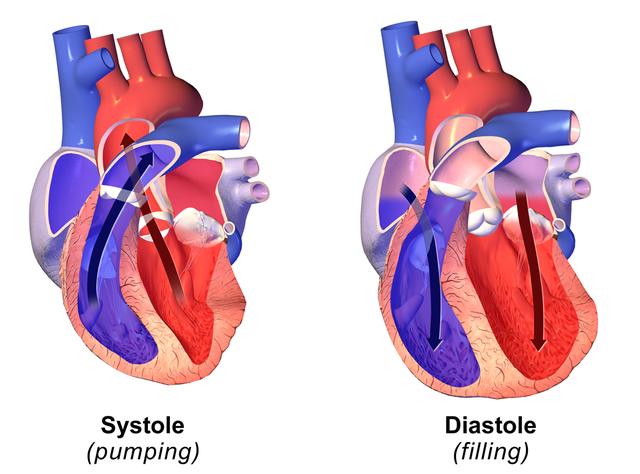
Systole = period of contraction, Diastole = period of relaxation
The ECG and the heart sounds are shown in a Wigger's diagram:
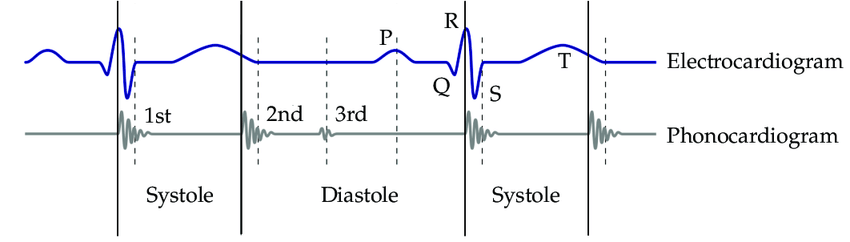
The practice of listening to the heart or lungs is called auscultation. The sounds of the heart are characterised by:
The first heart sound, S1 "Lub", marks the beginning of systole (end of diastole) and is related to the closure of the mitral and tricuspid valves.
It is loudest at the apex of the heart (the point of the heart, furthest away from the veins and arteries).
The second heart sound, S2 "Dub", marks the end of systole (beginning of diastole) and is related to the closure of the aortic and pulmonic valves.
It is loudest at the base (top of the heart).
One can relate the auscultatory findings to the cardiac cycle:
|
S1 |
S2 |
|
Just precedes carotid pulse |
Follows carotid pulse |
|
Louder at apex |
Louder at base |
|
Lower pitch and longer than S2 |
Higher pitch and shorter than S1 |
|
Because systole is shorter than diastole: |
|
|
The first of two grouped beats |
The second of two grouped beats |
Positioning of the stethoscope
The placement of this sensor is critical. A small movement (mm) can create a large degradation of both signal strength and quality.
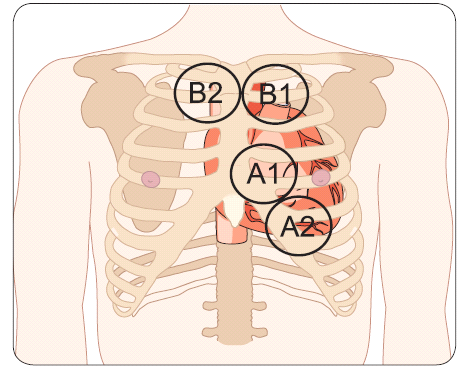
The above locations will produce a different pattern. Locations A1 or B1 are preferred for a ‘normal’ pattern.
General recommendations
Medical auscultation requires the patient to adopt different body positions to maximise the sound received by a physician. When using A1 and A2, asking the subject to lean forward from the hips, can give a dramatic increase in signal strength and quality. Typically, about a 30-degree lean is optimal; if the lean becomes too pronounced the signal degrades very rapidly.
One can improve the quality of the recorded sound if the patient is supine. Be prepared to try several positions. It should be possible, for most of the work, to slip the sensor through a shirt opening and place it in position. The sensor needs to be in contact with the skin for the best response. If the sensor is touching material the signal will be muffled and the movement of the fibres over the diaphragm will introduce noise.
If a piece of medium soft plastic foam is used over the chest piece, the subject can push down on the foam to hold the sensor in position. If the foam is not used the subject can still hold the sensor but they may introduce noise from the tremor of their fingers, hands, etc. The foam will also reduce the tendency to over-press the sensor against the skin; some of the best results will be collected with a light touch. The stethoscope diaphragm needs to be free to vibrate and transfer the sound waves to the microphone.
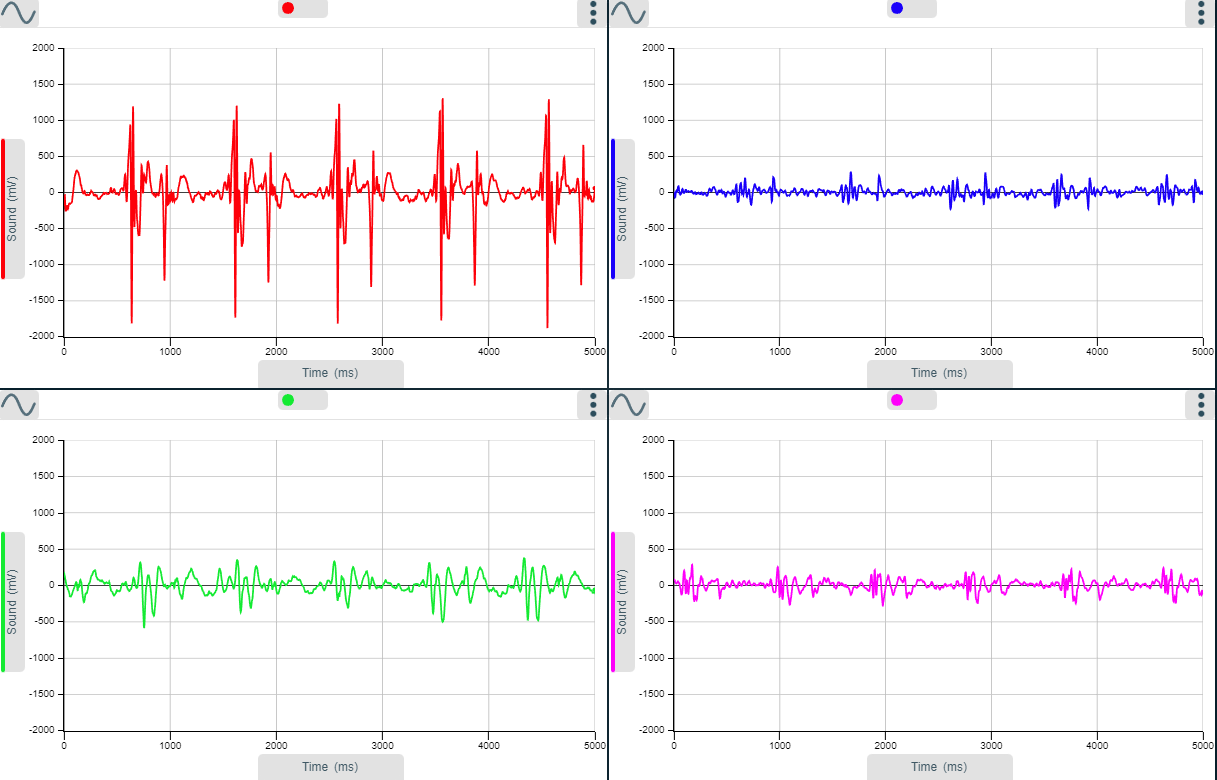
Sample heartbeats at the four locations (A1 top left, A2 Top right, B1 bottom left, B2 bottom right).
The intensity of the heartbeat will be affected by the sensor's location. A relocation of even a few millimetres can increase the intensity considerably. Try moving the sensor over several data collections and locate the optimal spot. Human variation will play an important role; the positions indicated are starting points for the maximum response, not absolutes.
Recording heart sounds
Use the Stethoscope Sensor, set to the stethoscope range with the diaphragm fitted. Link this to an EasySense Installation
- Start the EasySense software and select Graph. Use the set-up table below to set the recording parameters. Do not select Start.
- For most investigations, use position A1 or B1 as indicated on the diagram above.
- Be prepared to make several recordings while finding the most responsive area. A little light exercise to stimulate the heart can make the task easier: you won’t need vigorous exercise - climbing a few steps will be sufficient!
- Use the Stethoscope Sensor with the diaphragm on; once you have found the best recording spot you can compare the recording without the diaphragm.
- It should be possible to slide the sensor through clothing to reach the desired region.
- Place the foam pad on the sensor and push on the pad to press the diaphragm of the sensor to the skin. After a few attempts you will find the foam is not required. Initially there is a tendency to press too firmly. The foam pad reduces the pressure on the sensor and helps to isolate the sensor from stray noises generated by clothing, finger pulse, etc.
- When you use the correct pressure, you should feel the sensor on the skin but not feel it pressing into the body mass.
- When you feel the sensor is correctly in place click on Start and review the recording. Use the information collected to decide if the sensor needs moving, or you need to change your body position. Try a few variations to find the best result.
- When the recording is as good as it can be, Save the data!
- Try recording the heart noises at the various locations indicated with and without the diaphragm. Use Overlay to collect the samples recorded onto one graph for comparisons.
You need to record with a short inter-sample time over a period of about 5 seconds.
|
Recording method |
Length of recording |
Inter-sample time |
|
Graph/Continuous |
5 seconds |
2 ms |
This set-up does not include a trigger. It should record a minimum of four sets of heart sounds (i.e. four heartbeats). You will likely collect five sets, but one set may be split over the beginning and end.
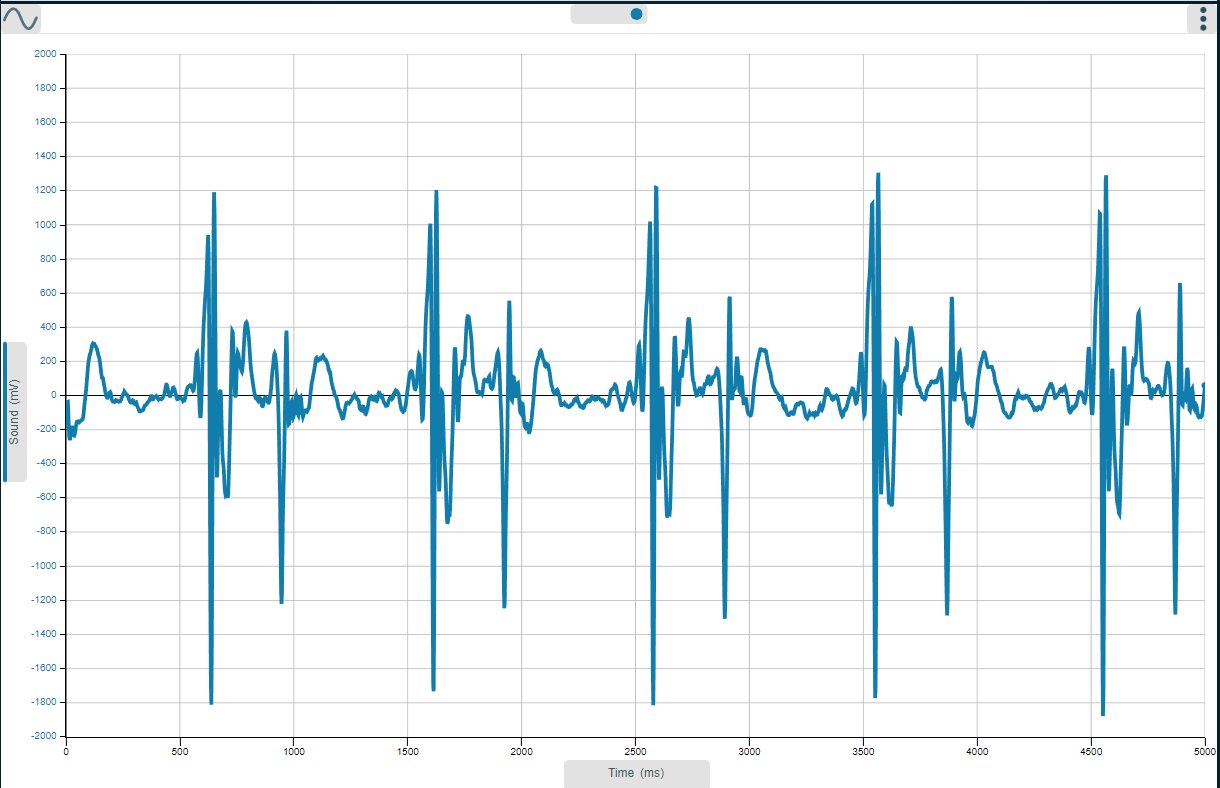
Sample heart sound trace (scale, Min Max used). Note how the heart sound appears as couplets: one is often louder and longer in duration, this is the S1 sound. Refer to the heart sound information earlier in this document for a description. The heart sounds in the example were collected with the subject leaning forward slightly with the sensor at position A1.
Using the auto scale will often create a confusing graph. You should be looking to see a double beat pattern. The first beat will be stronger and of longer duration. The time interval from the beginning (S1) of one double beat to the next (S1) double beat is one cycle of the heart's beating rhythm.
Physicians use a stethoscope to listen to the circulatory sounds - most commonly when measuring blood pressure. The sampling period of the software and the dynamic range of the microphone will make it difficult to identify the subtle changes in noise a physician is trained to identify, however, you should be able to demonstrate an audible pulse at the traditional pressure points:
- Use the same recording method as used to record heart sounds.
- Place the sensor over the pressure point (at joints, where the musculature is reduced, and the blood vessels are closest to the skin).
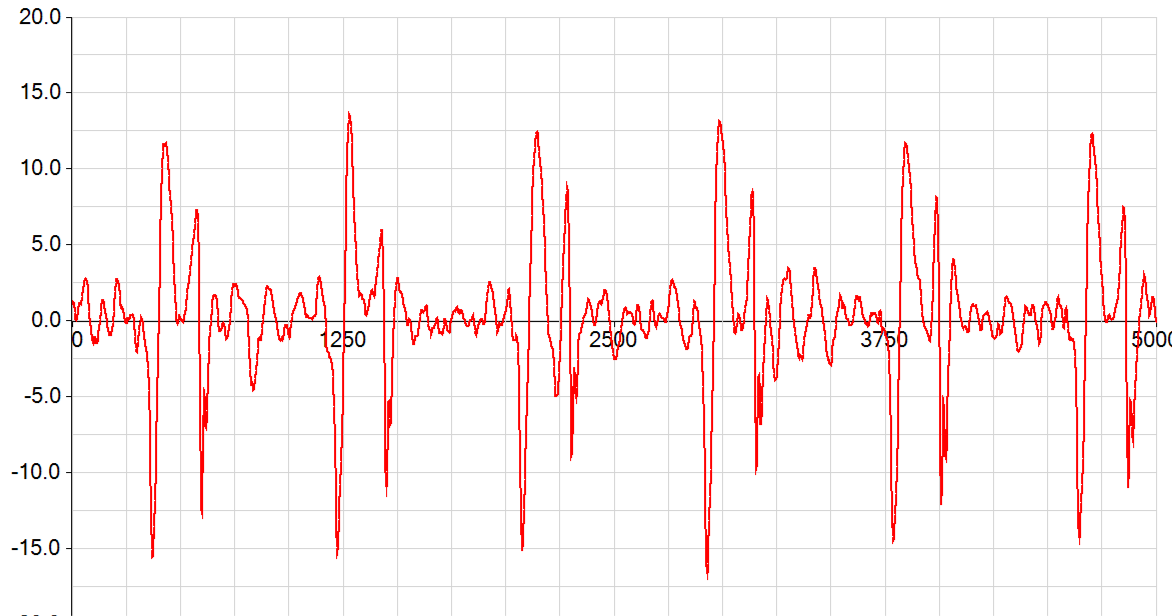
Recording of the pulse in the neck - time displayed in milliseconds.
The sensor had been placed at the end of jaw on the lower edge of ear (left side). This location is useful as it shows a good pulse and is easily located by most students.
Usage with other sensors
This is a more complex investigation, but well worth the effort. It offers many teaching possibilities from a simple model of the role of medical electronics, to help with the understanding of the diagrams and explanations of the heartbeat in physiology texts and lessons.
The Heart Rate Sensor indirectly records blood pressure, it is not calibrated. As the blood flows around the body, it does so in a pulse format. Each pulse represents the output of the heart and is a pressure wave travelling around the system. The pressure wave peaks with the peak of blood expulsion from the ventricles (i.e. the point at which the valves open and blood moves from the ventricle into the aorta).
It should be possible to collect data that will compare favourably with diagrams seen in texts that combine heart sound, and ECG, pressure (we cannot record flow though).
Apparatus
- One Stethoscope sensor set to the Stethoscope range with diaphragm fitted
- One foam piece
- One ECG sensor and electrode patches
- A Heart Rate Sensor set to the waveform range
- An EasySense installation capable of fast logging
Note: You may want to use the conventional stethoscope to locate the best position for the heart sounds.
- Connect the ECG as shown in the ECG sensor manual. Make sure the areas that will receive the electrode patches are thoroughly cleaned with alcohol to degrease the skin. It is worth positioning the patches early, they sometimes seem to need a “resting” period before maximum conduction is achieved.
- Use a finger to record the Heart waveform. Evaluate the result, you may need to swap the finger to get a pulse that is either big enough to see or is not so large that the waveform is lost.
- Finally, find the best position for the Stethoscope sensor (using the conventional stethoscope). Use position A1. If the test subject is willing, use a biro to mark the position of the best response (do make sure the ink can be removed!).
Experimental parameters
You need to record with a short inter-sample time over a period of about 5 seconds.
|
Recording method |
Length of recording |
Inter-sample time |
|
Graph |
5 seconds |
2 ms |
This set-up does not include a trigger. It should record a minimum of four sets of heart sounds (i.e. 4 heartbeats). You will likely collect five sets, but one set may be split over the beginning and the end.
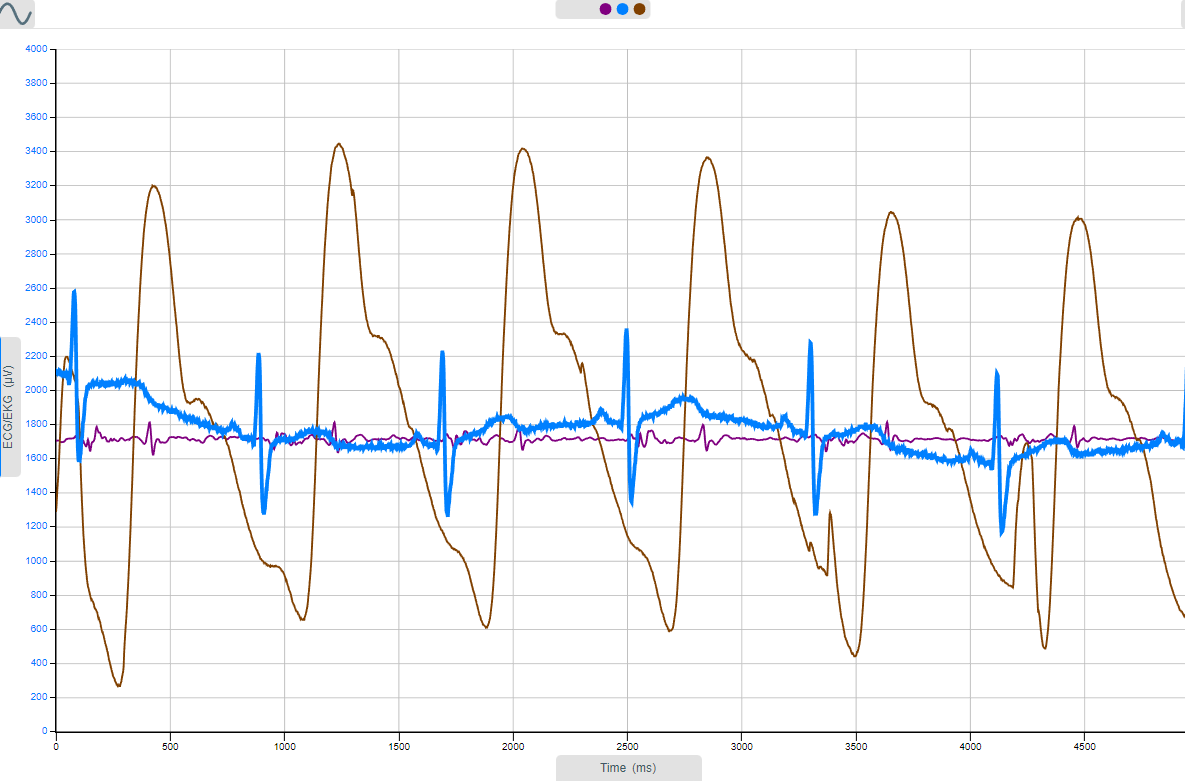
Stethoscope, pulse waveform and ECG data: sensor settings, Y-axis multi-scale
Events of the heart
|
|
Cycle Component |
Major Pump Event(s) |
Electrical Event(s) |
|
|
Diastole |
Ventricles and atria relaxed; passive filling |
|
|
SA-node "fires"- current flows throughout the atrial muscles and into the AV (atrioventricular) node |
|
|
|
|
|
Atrial Depolarisation |
|
P-wave |
|
|
Atrial Contraction |
Atria force blood into the ventricles |
P-wave ceases |
|
AV node incorporates a delay (approx. 110 ms) into the conduction route from atrium to the ventricles |
|
|
|
|
|
Atrioventricular delay |
|
Atrioventricular Delay |
|
|
Ventricular depolarization; atrial re-polarisation (masked by Ventricular behaviour) |
"LUB" heart sound |
QRS complex |
|
|
Ventricular Contraction |
Ventricles force blood into the pulmonary artery & aorta |
(latter parts of QRS) |
|
|
Ventricular re-polarisation |
Ventricles in late contraction followed by the initiation of ventricular relaxation: "DUB" heart sound |
T-wave (current flow between depolarizing and re-polarizing parts of ventricles) |
The above image is courtesy of: https://en.wikiversity.org/wiki/WikiJournal_of_Medicine/Medical_gallery_of_Blausen_Medical_2014