Practical Investigations
The Smart Wireless Colorimeter and Turbidity Sensor can be used to investigate a range of diverse scientific experiments:
- Photosynthesis investigations – monitor changes in pigments or products of photosynthesis.
- Respiration experiments – investigate changes associated with cellular respiration.
- Water quality testing – measure turbidity before and after filtration or treatment.
- Water pollution studies – compare turbidity and colour in samples from different locations.
- Soil run-off investigations – measure suspended particles in water following rainfall.
- Coagulation and flocculation – investigate how effectively treatment chemicals remove suspended particles from water.
- Sedimentation studies – measure how quickly suspended particles settle out of water.
- Food and beverage analysis – investigate colour changes during processing or storage.
- Milk and dairy investigations – study turbidity changes associated with dilution, precipitation, or microbial growth.
- Fermentation experiments – monitor microbial growth during yeast or bacterial fermentation.
- Oxidation–reduction reactions – follow colour changes as reactants are oxidised or reduced.
- Photochemical reactions – investigate how light affects the rate of a colour-producing reaction.
- Drug or pharmaceutical analysis – determine concentrations of coloured compounds in controlled laboratory investigations.
- Vitamin C investigations – measure changes in colour during reactions involving ascorbic acid.
- Antioxidant investigations – compare the reducing/antioxidant capacity of different samples.
- Dye degradation – investigate how light, chemicals, or microorganisms break down coloured dyes.
- Water disinfection studies – investigate changes in water quality following different treatment methods.
- Aquatic ecosystem studies – monitor changes in water clarity associated with algal or plankton growth.
- Industrial wastewater investigations – compare turbidity before and after treatment.
- Environmental monitoring – track changes in water colour and turbidity over time at different sampling sites.
Example Data:
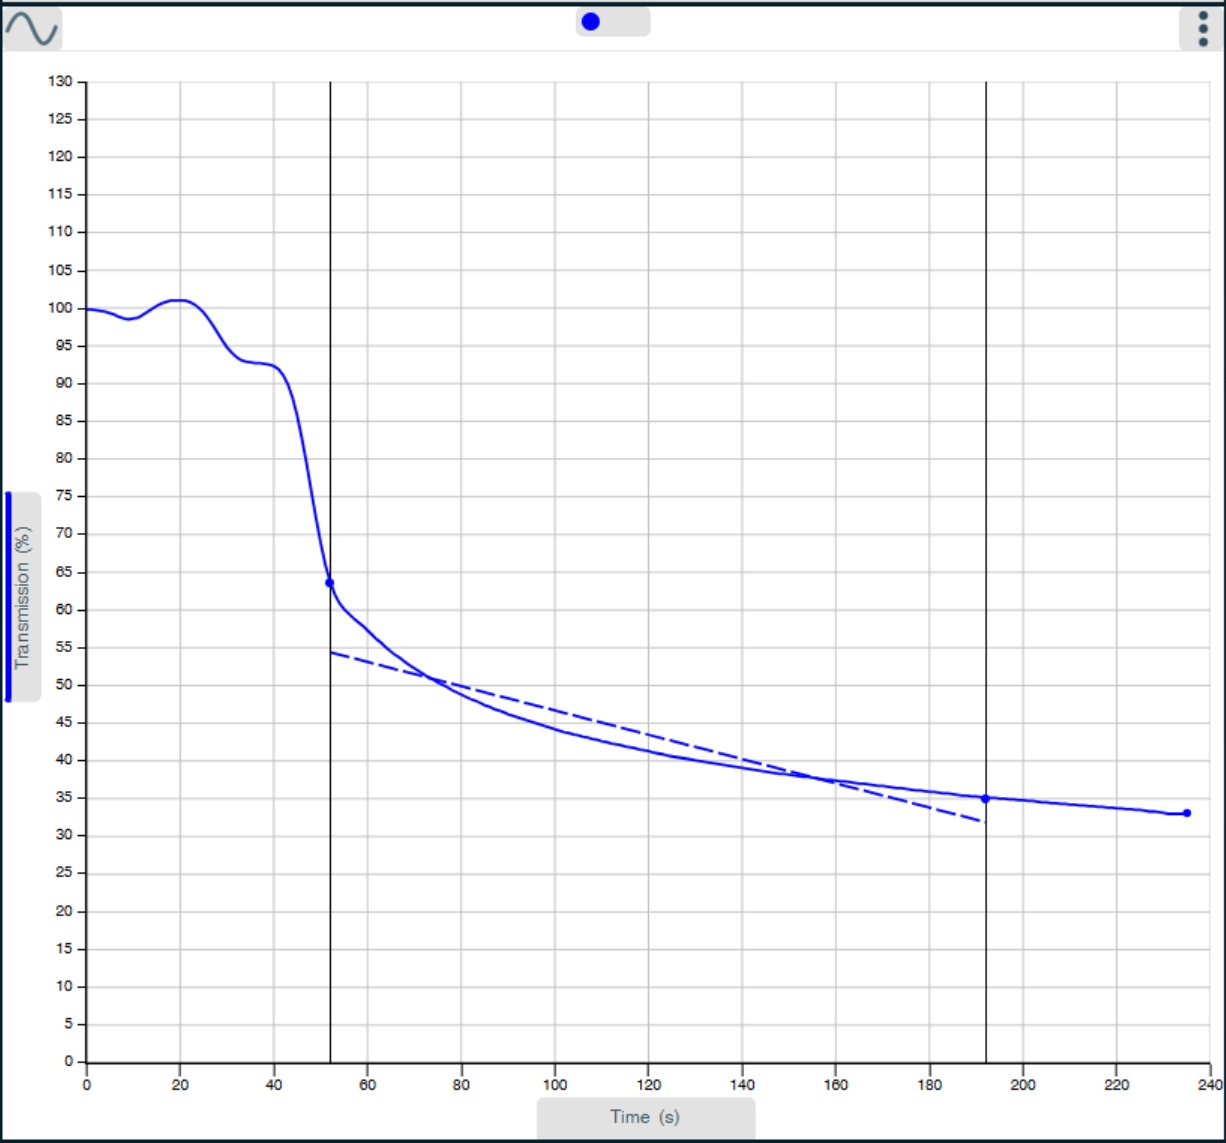
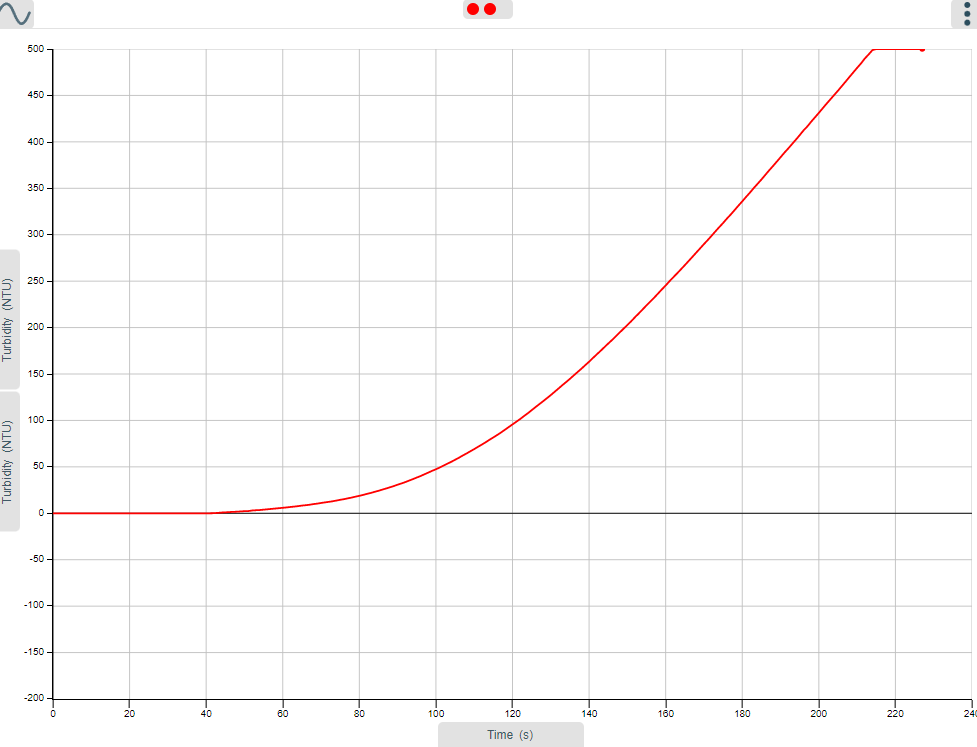
1. Demonstrating Turbidity Development: Sodium thiosulphate and hydrochloric acid, monitored using the
turbidity function. The reaction produces a deposit that develops in time
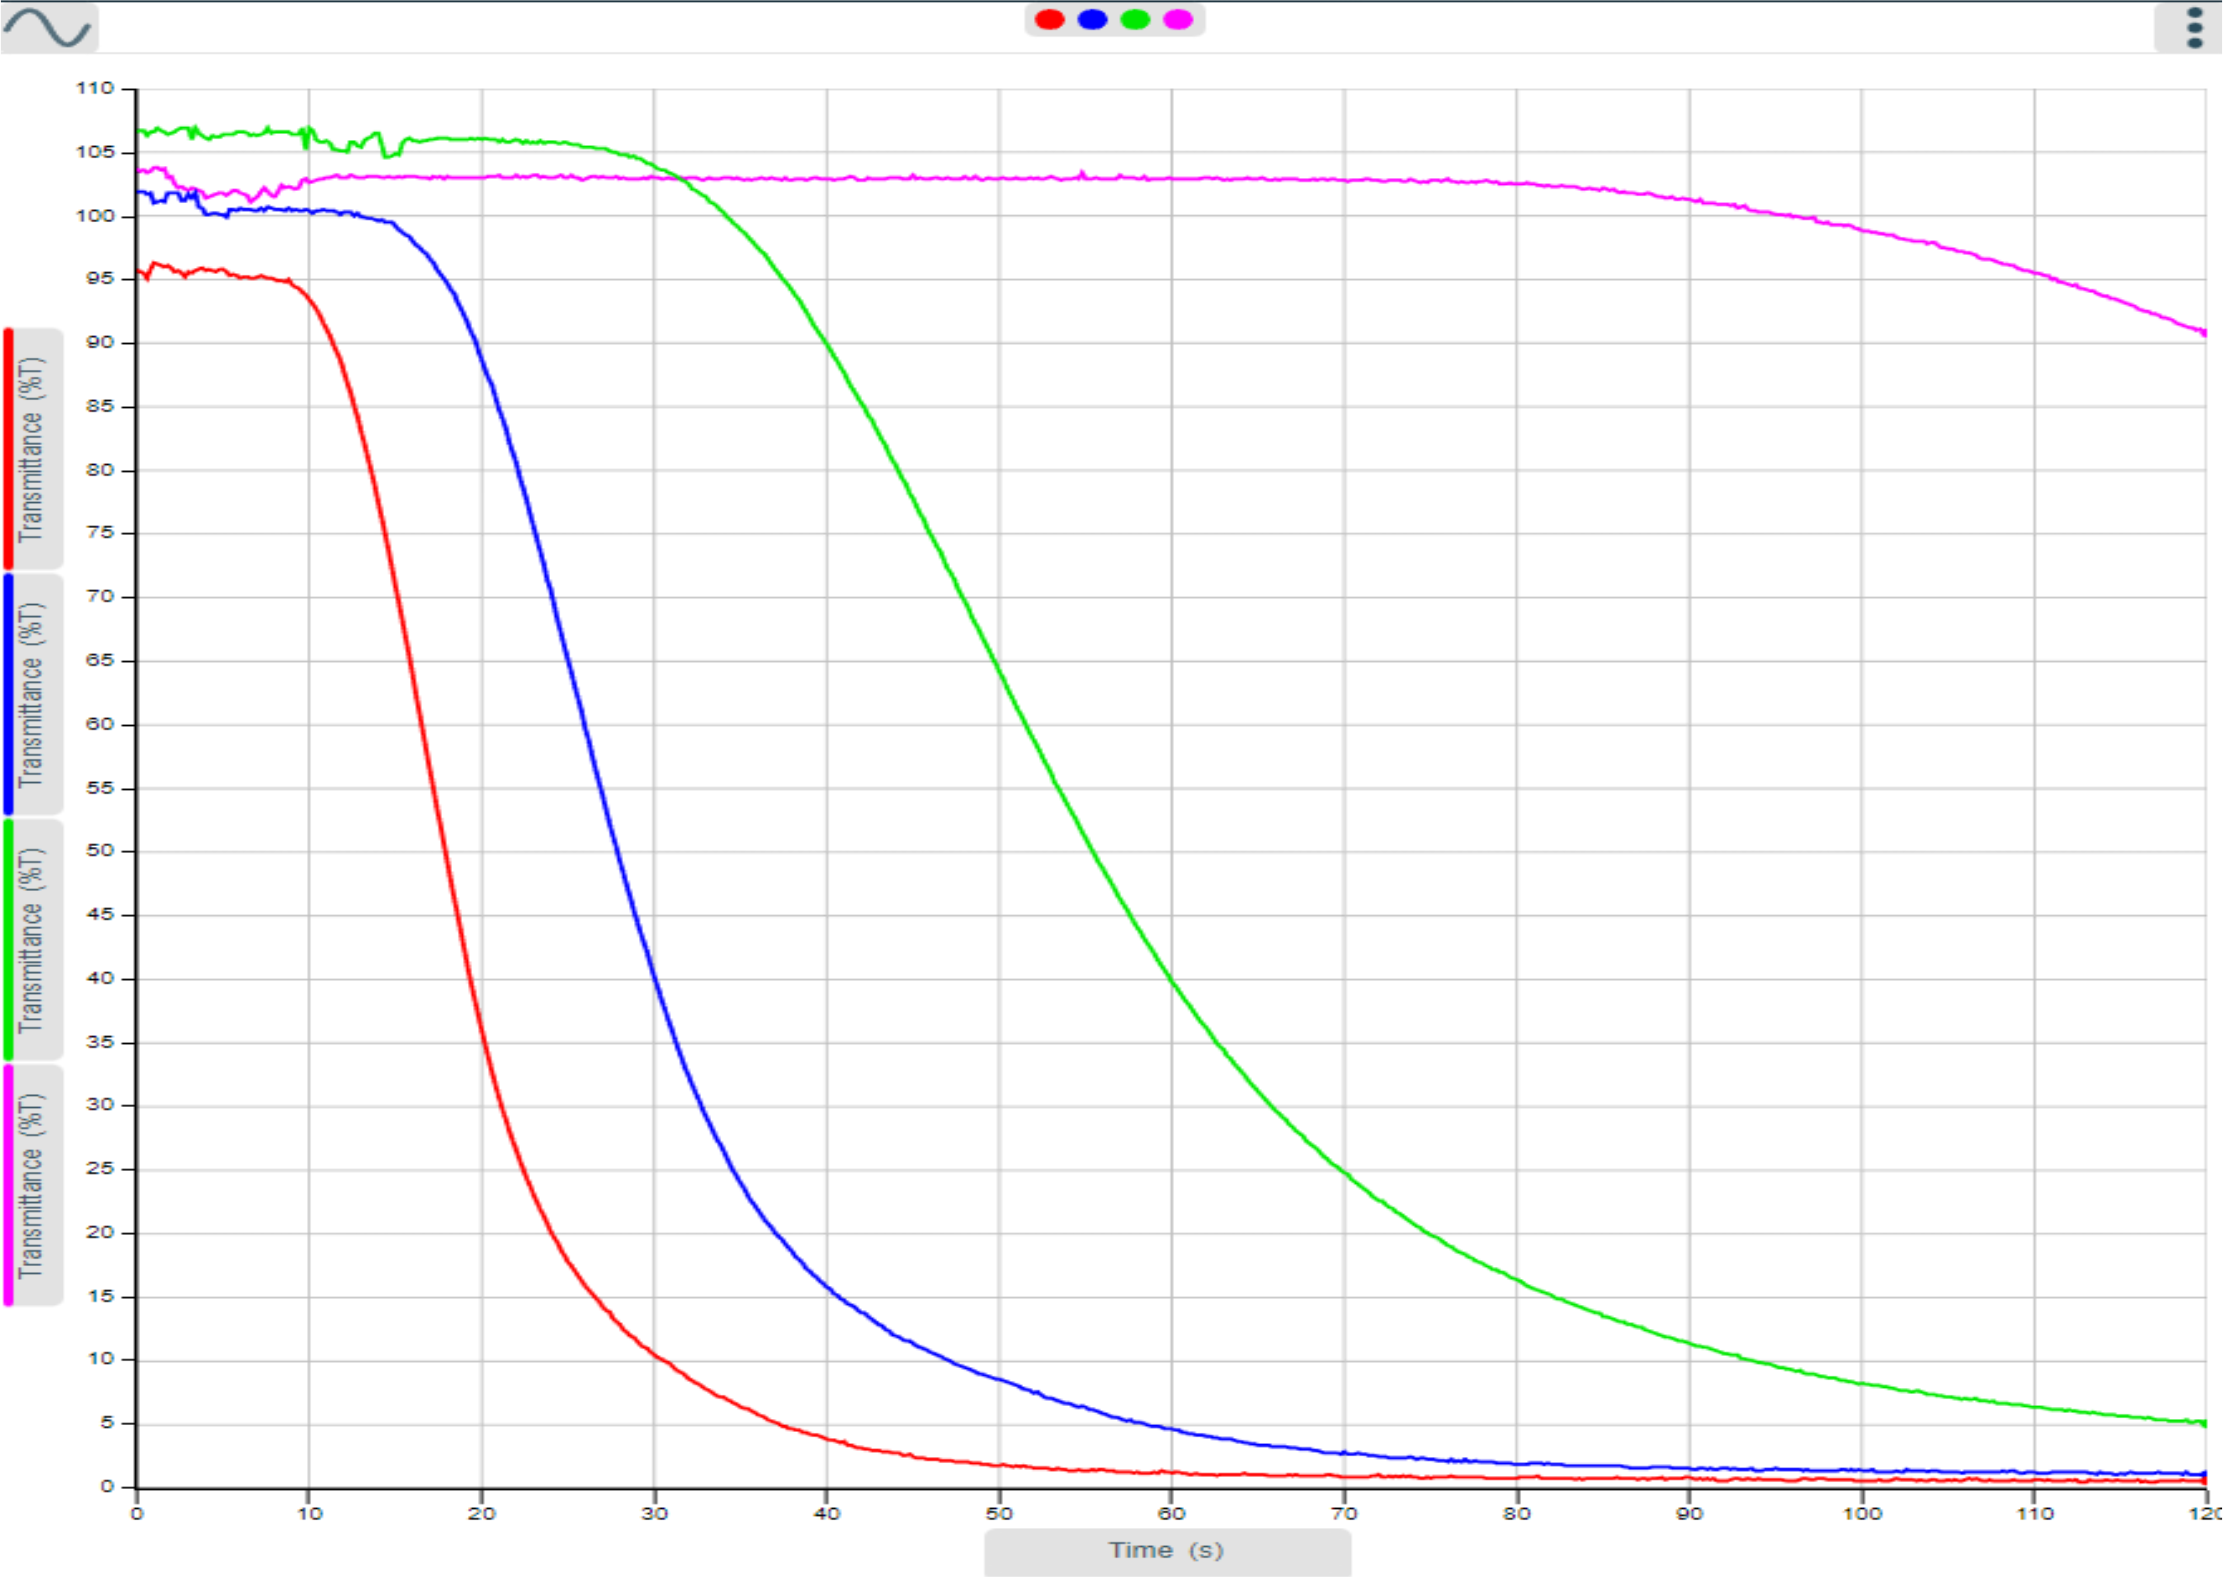
2. Demonstrating Reaction Rates: Sodium thiosulphate (variable) and hydrochloric acid Reaction, monitored using the colorimeter
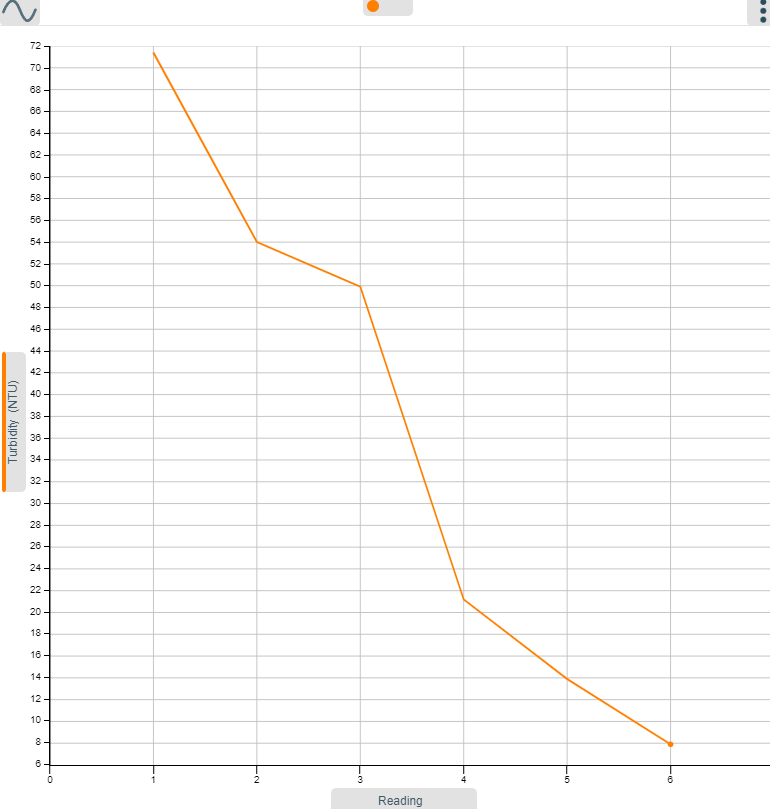
3. Storm surge turbidity measured days following the event
4. Variation of Chlorophyll concentration as it is added to a reaction cuvette