Usage Information
Rainfall has a heavy impact in our lives. The average yearly rainfall across the Earth is around 1000 mm, but averages don't alone show the degree of variation. The highest rainfall is to be found in and around the equator, and especially in South East Asia. The most rainy countries can have as much as 3240 mm - such as in Columbia.
Rainfall for some selected cities is given in the table below. Perhaps London isn't so rainy after all!
|
Location |
Yearly rainfall/inches |
Yearly Rainfall/mm |
|
Lima |
0.2 |
5.1 |
|
Dubai |
4 |
101 |
|
Madrid |
17 |
431 |
|
Rome |
23 |
584 |
|
London |
24 |
609 |
|
Nairobi |
40 |
1016 |
|
New York |
47 |
1193 |
|
Tokyo |
60 |
1524 |
|
Bergen |
82 |
2082 |
|
Singapore |
90 |
2286 |
Source: skyscrapercity.com
Rainfall distribution has become a very sophisticated discipline, where statistical analysis can play a very important role. Since rainfall is governed by many factors, application of mathematical modelling can help forecast how the likely rainfall will behave. For example, a normal distribution for rainfall, f(x), can be represented by:
f(x) = 0.39σ-1exp{-0.5[(x-μ)/σ]2}
where μ = the mean value, σ is the standard deviation, if σ > 0.
A weather station is a commonly used but vital tool for helping to track and forecast weather. The Rain Gauge is a key component of this. With this Rain Gauge Pack, you can start to build your own rugged weather station. It can be linked as a common platform using EasySense software, and from this you can do sophisticated analysis - comparing one variable with another.
The generation of rainfall is part of the complex behaviour to be found in weather systems. Generally, we associate low pressure with rain (as water elevates and then precipitates). High pressure we think of the reverse - air presses down reducing the risk of precipitation. A Rain Gauge, working in conjunction with a an atmospheric pressure sensor and anemometer can provide timely data.
Agriculture and the cultivation of plants, is influenced by rainfall. Heavy rainfall may have a beneficial effect on agriculture, if the drainage is well developed.
Soil distribution diagram
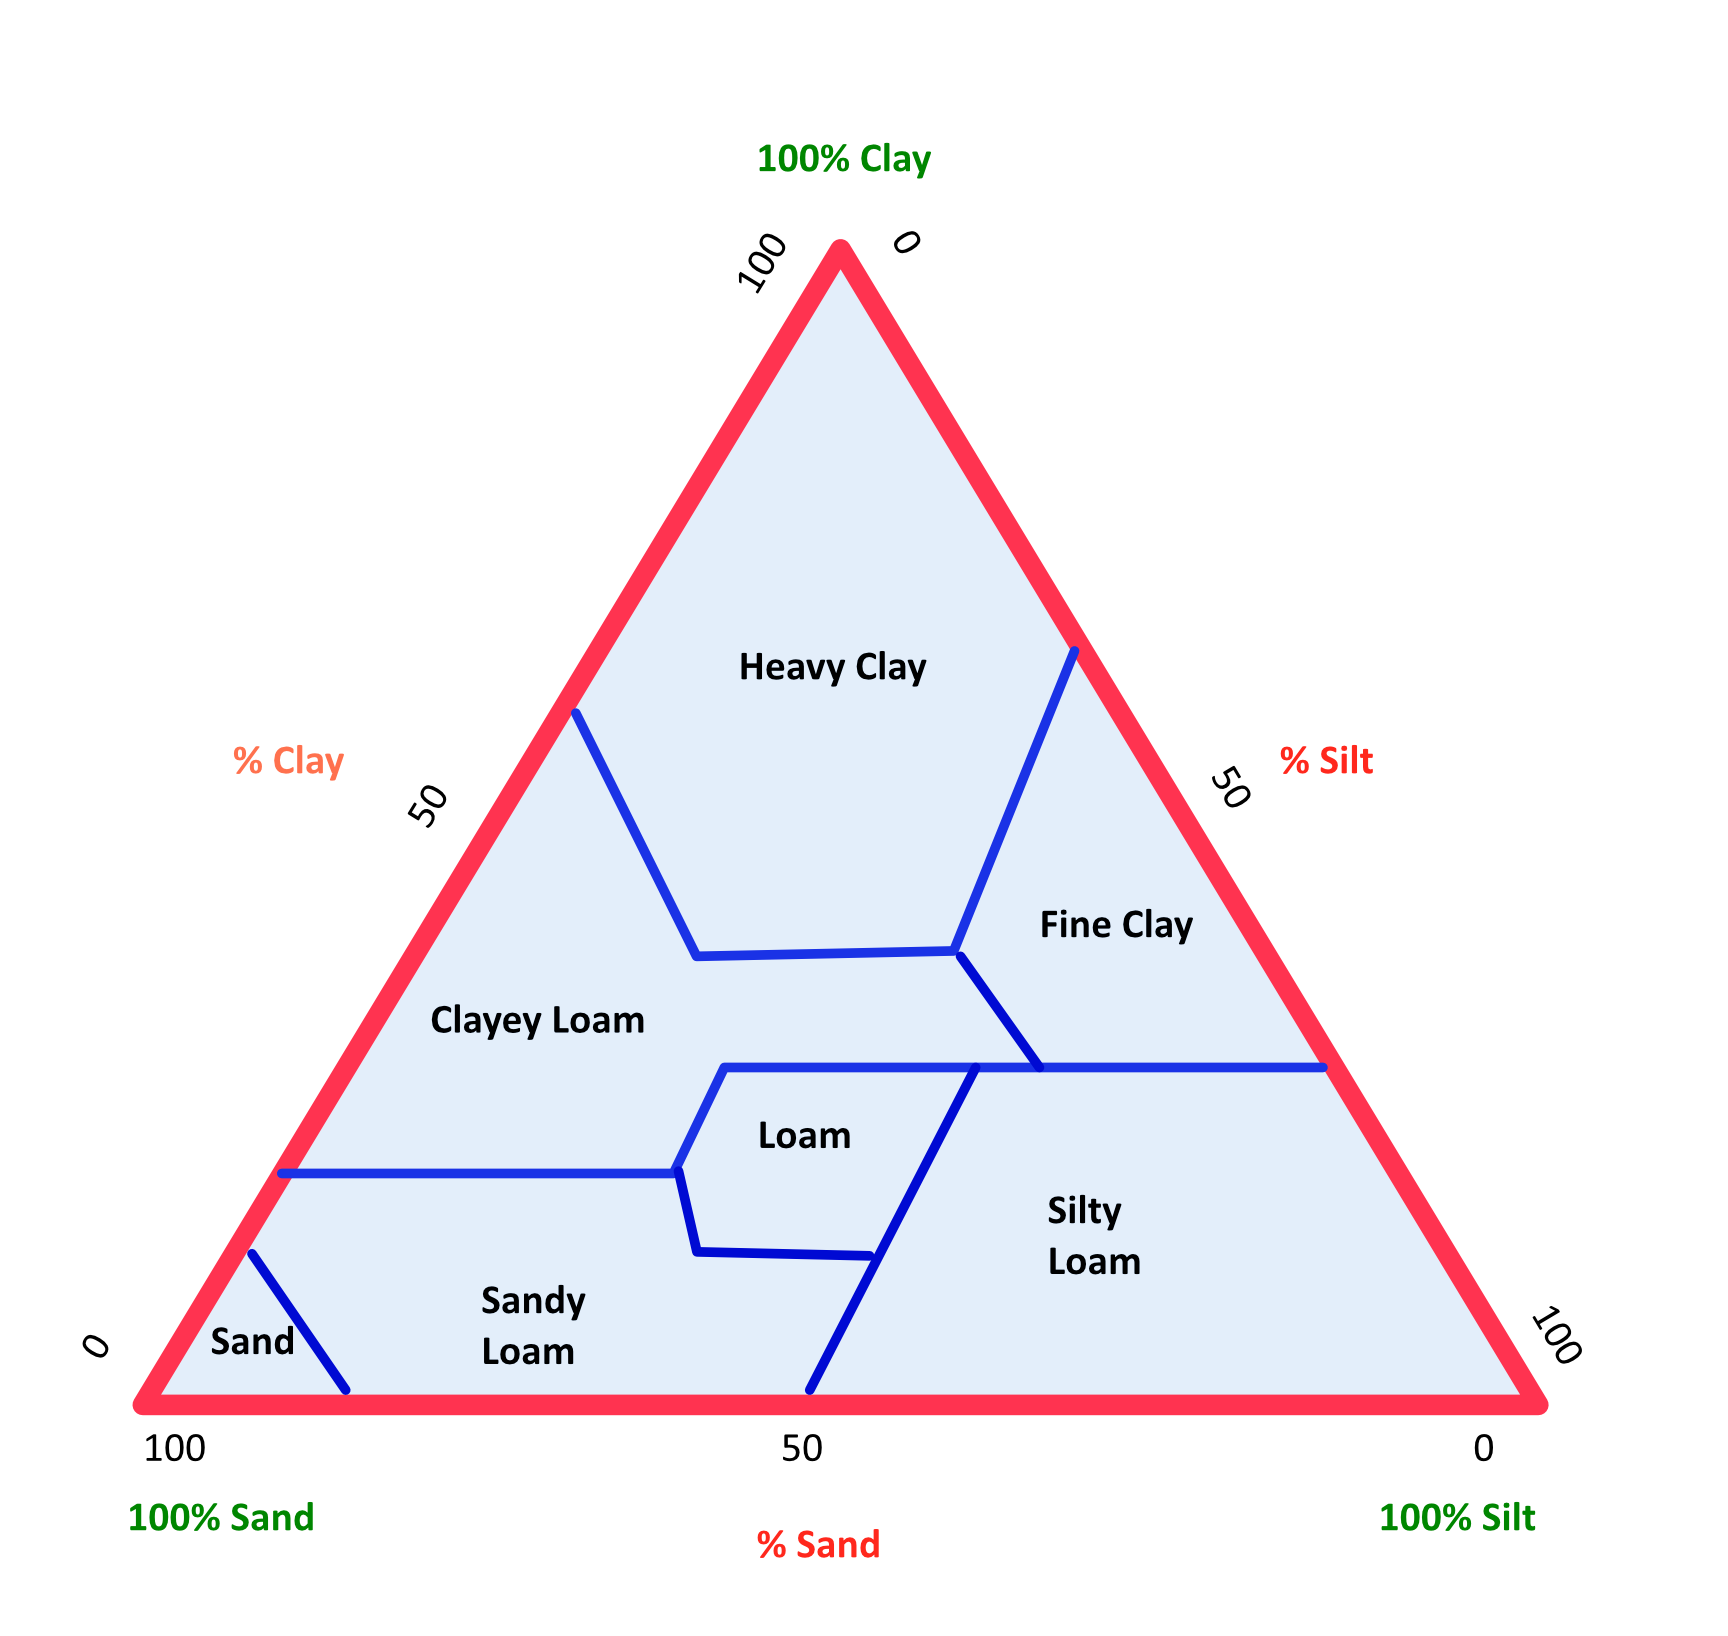
The typical constitution of soil can be considered to made up from intermixing sand, loan and clay (see diagram below). Water can be quickly absorbed by sand, but to a lower volume than clay. So, surface water can be problematic if clay takes too long to absorb water, or there is sand which is already saturated and free to drain. Not all soil types are good at retaining moisture: sand is up to 30%, loan, 45% and clay above this. So, the rainfall doesn't equate to well-watered soil.
Some of the driest lands are in the Middle East, Egypt, for example, and the soil make-up has an impact on water retention. Following the measurement of rainfall, an estimate of the soil moisture can be made with an appropriate instrument. By dynamically monitoring both, the environment can be better controlled and protected.
Protecting the environment involves not only an appreciation of what can cause damage, but also how to make sure that the potential damage is under control. With wind, we can use an anemometer to track oncoming threats, and we use materials that can withstand the immense forces that can be generated. With water, correct drainage and storage are vital to not only protecting property, but to budget for our needs. A Rain Gauge is a very effect tool to help us do this.
Using the gauge
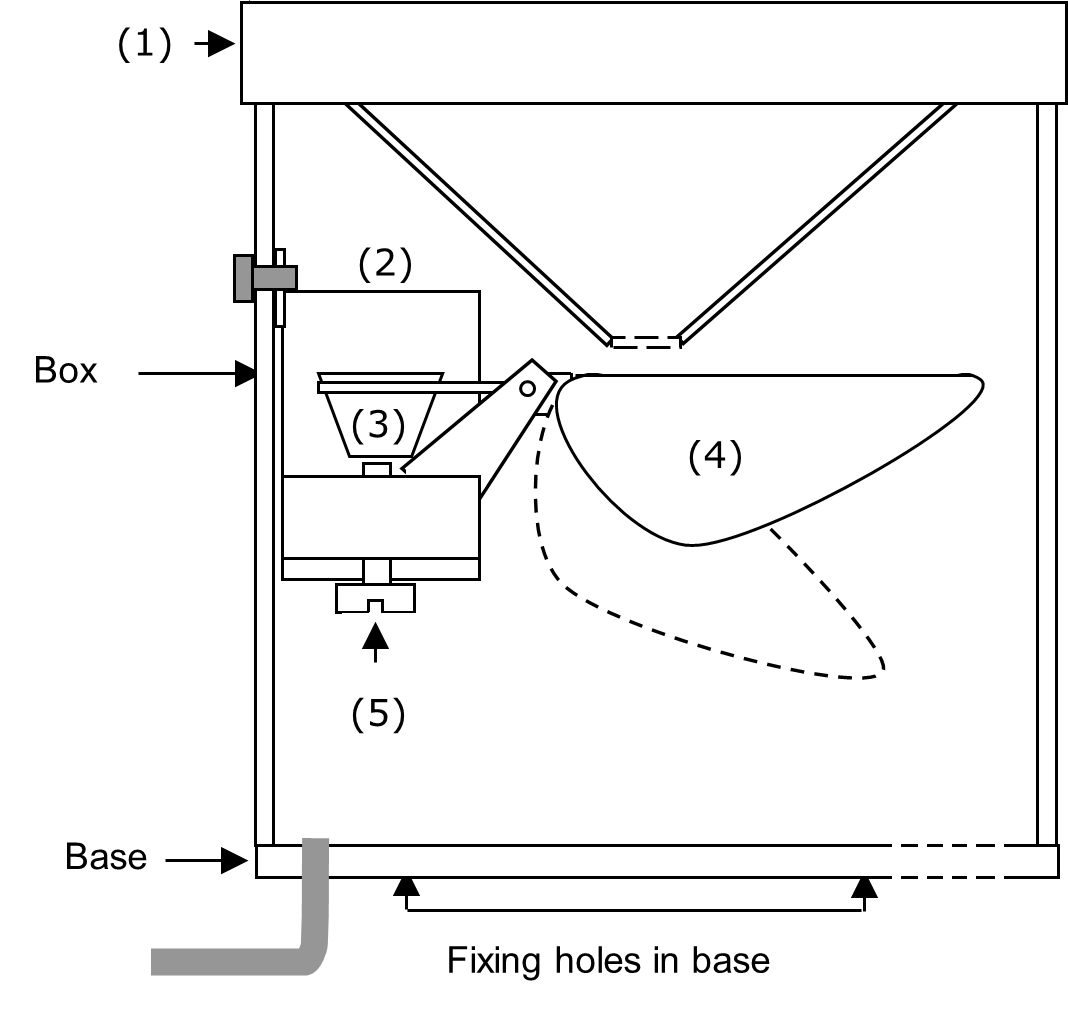
The Rain Gauge registers rainfall by rain water landing in the funnel-shaped top (1), which leads the water down into a self-emptying spoon (4). The spoon is balanced on a pivot and held by a magnet that is in contact with a switch. The magnet exerts just enough tension so it will release its hold when the spoon is full - causing the spoon to tip, empty and return to its normal collecting position in one quick movement. When the spoon tips it triggers the switch from normally closed (ON) to open (OFF).
The spoon automatically tips and empties each time the spoon registers 5 g of water (the equivalent of 1 mm of rain has fallen). Total rainfall is measured by counting how many times the spoon tips.
The Rain Gauge is made of STYROSUN which is a very endurable and weatherproof material resisting the sun’s UV radiation and extreme frost and heat temperatures.
The Rain Gauge consists of 3 parts, funnel, box and base plate, which can be taken apart and assembled again without the use of tools.
1. Funnel with grill
2. Box with self-empting spoon
3. Base for mounting on a fence or post or some other suitable position
4. The self-emptying spoon
5. Adjustment screw
Connections
Connect the jack lead from the rain gauge to the jack socket on the side of the Tachometer Sensor.
Select the range of the Count/Tachometer adapter as Rain Gauge (mm) in EasySense software.
The LED will illuminate when a count is detected.
The connecting lead
The Rain Gauge comes with a 10 m lead ending with a 3.5 mm jack plug, which is used to connect to the tachometer. The lead maybe lengthened by using 3.5 mm male/female jack extension cable.
Mounting instructions
1. Remove the base from the box.
2. Place the base horizontally and fix it to a fence, post or similar using two screws through the two holes provided in the base.
3. Press the box back into place over the base making sure the lead fits into the notch in the base provided for it.
4. If the funnel has been removed from the box, fit it back into place using gentle pressure.
Getting the most accurate results
1. Position on a flat surface – if the surface isn’t flat, the bucket may not tip at the calibrated level so the calculated rainfall will not be correct.
2. Position on a surface that does not vibrate or move.
3. Dirt and debris falling in the funnel may block the grill so don’t place too close to a tree.
4. Inaccurate readings maybe caused by the amount of rain collected being dependant on wind direction.
5. Don’t locate near any magnetic, steel, or iron objects which may affect the anchoring effect of the magnet.
Adjustment and calibration
This instrument has been carefully adjusted at the factory, but further adjustment can be made in the following way:
Carefully lift the funnel and box clear of the base plate and tip on its side.
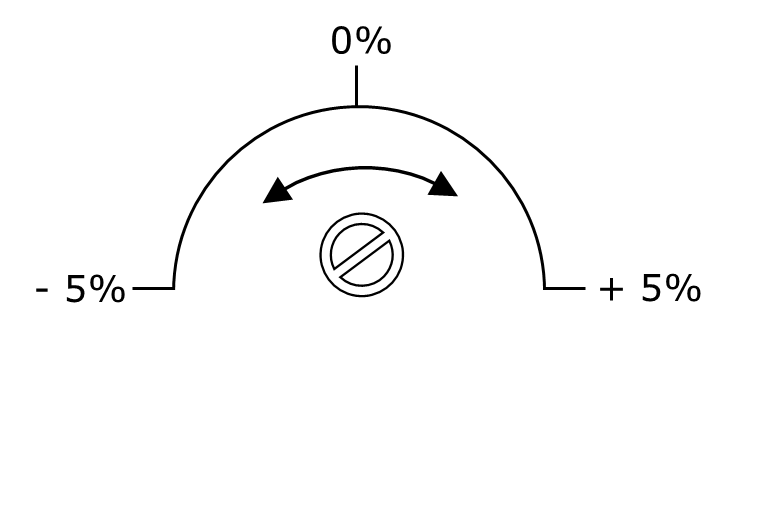
Locate the adjustment screw, visible under the measuring spoon.
On the inside of the base plate is a diagram showing the effect of turning the adjustment screw, clockwise is positive, counter-clockwise is negative.
To check your adjustment, measure 500 cm3 of water. Drip the water very slowly through the funnel – this should take at least 15 minutes. If the rain gauge is correctly adjusted the Count/Tachometer should read 100 mm.
If the display does not show 100 mm, then make further adjustments by repeating the process described above until it does.
Maintenance
The device is relatively maintenance-free, but we would recommend the following.
Please take care to store the instrument upright and care not to damage the attaching cable.
Do not clean with plastic dissolving solvents.
When in use (outside), try to protect the connecting cable and tachometer with a shield.
Periodically check the calibration. Any linear adjustments to data can be made in the EasySense app.