Usage Information
Vu Pro – EasySense And Stand Alone Operation
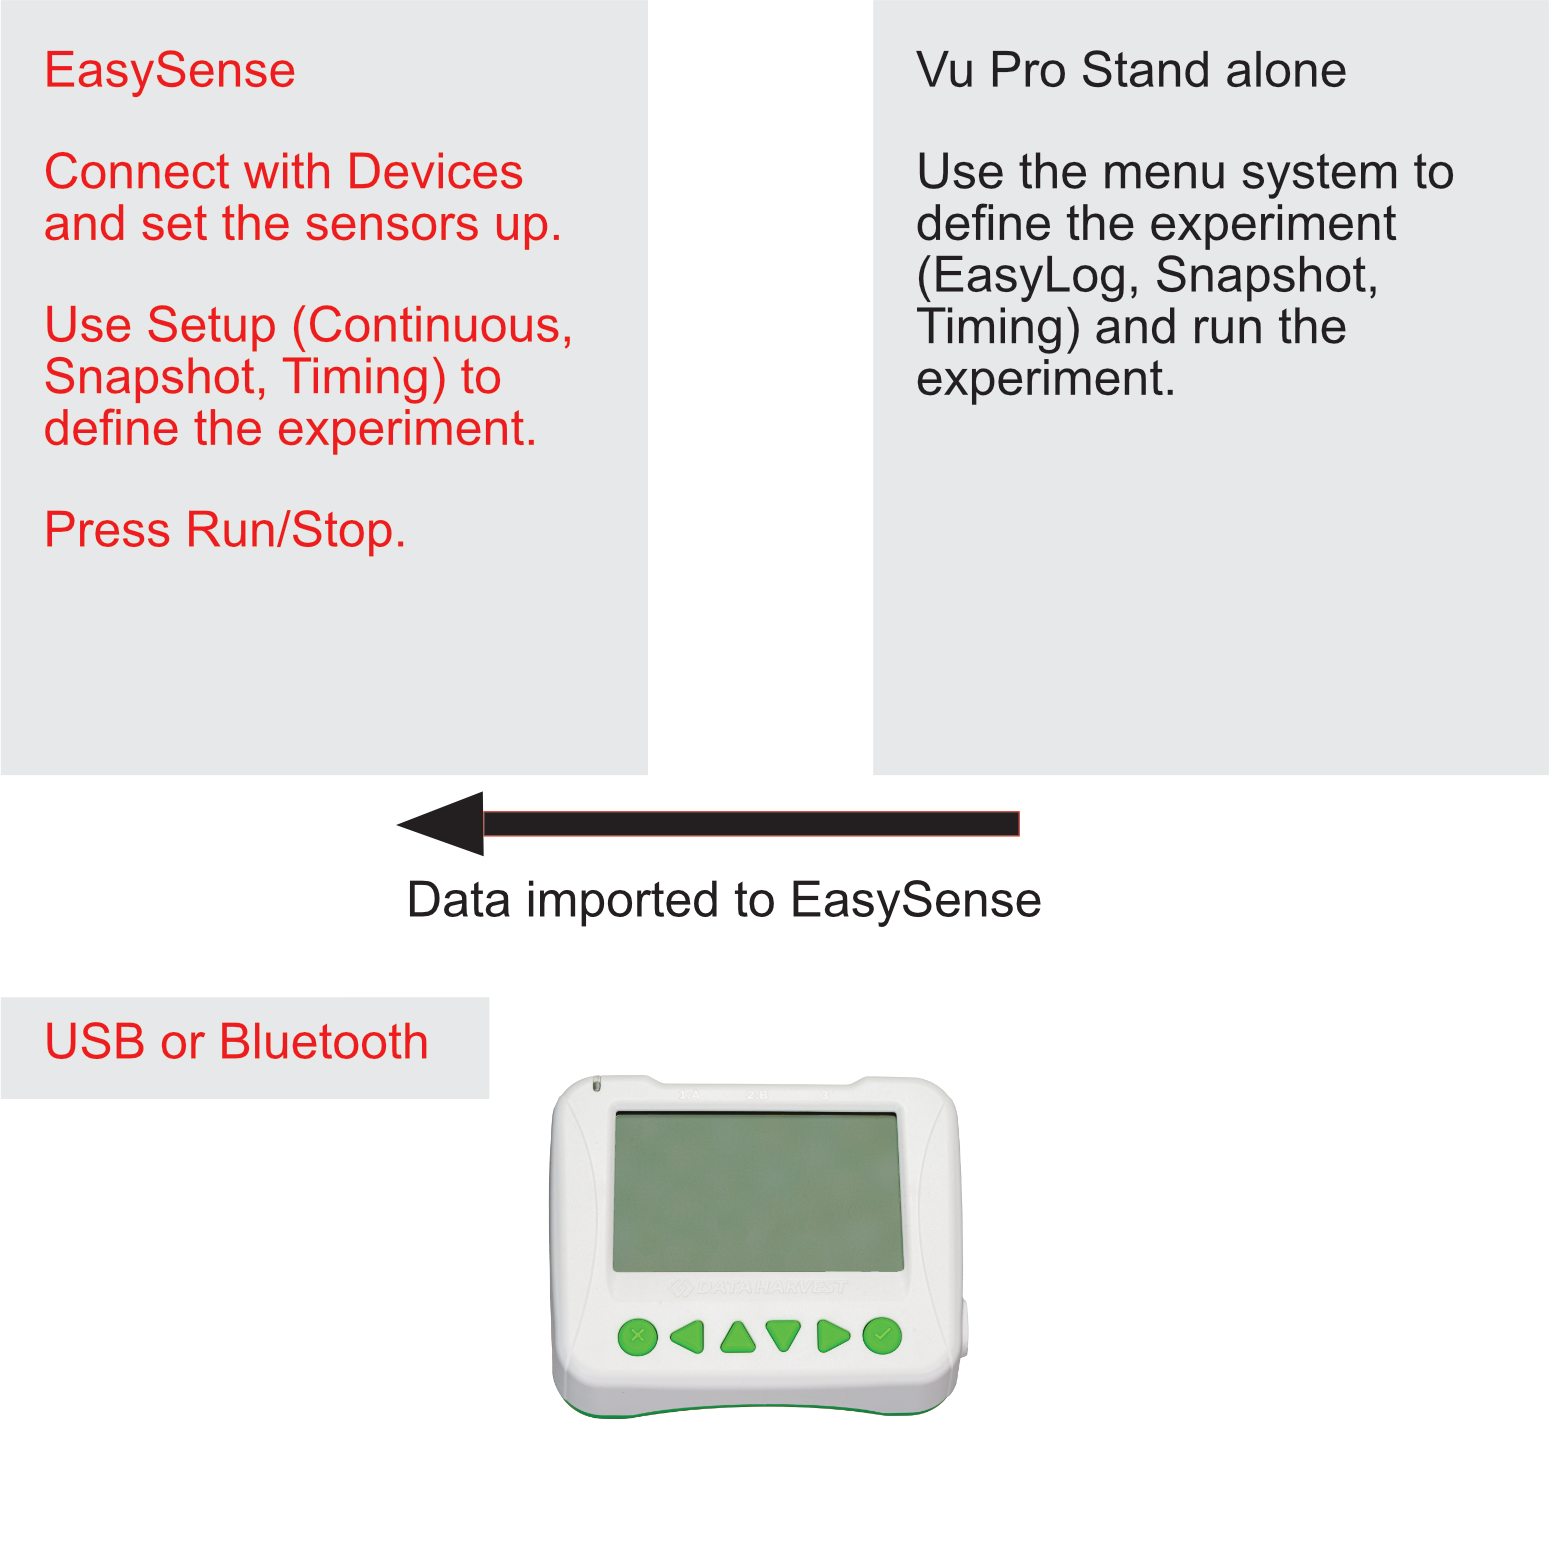
There are two fundamentally different ways to collect data using Vu Pro.
1.Using Vu Pro with EasySense software to capture data directly.
2.Using Vu Pro as a stand alone device, collecting data independently and then importing it into EasySense later for review and analysis.
Note: Vu Pro does not include a fully fledged version of the EasySense Software as part of its firmware, and provides a numerical representation of the selected data logging mode. To see graphical representations of real-time readings such as meters, bar charts, and graphs etc. please use the EasySense Software.
EasySense Stand alone
Vu Pro – Quick Start Guide
1. Charging The Vu Pro
•Use the USB cable included.
•Connect to a computer, USB power hub, or USB mains charger (5 V, ≥ 500 mA).
•White flashing LED = charging (Vu Pro On), red, green and blue flashing, Vu Pro is off
•Solid green LED = fully charged, A full charge takes about 4 hours.
The status of the battery is shown on the main screen and is charged using the USB cable to a compliant supply. The battery level indicator is the following icon: 
2. Turn On The Vu Pro
•Press any front-panel button.
•The screen will light up and the blue LED will flash (Bluetooth advertising).
To turn off the Vu Pro:
•Let it sit idle for 2 minutes, or
•Use System → Switch Off.
The Use Of External Sensors/Probes
🔌 Note: Always connect plug-in sensors before entering a logging mode (except Meter mode). In Meter mode, sensors are identified and begin displaying immediately.
3. Optional Connect To EasySense (USB or Bluetooth)
USB Connection
1.Plug in the USB cable provided.
2.Open the EasySense app.
3.The Devices icon turns green when connected.
Bluetooth Connection
1.Turn on the Vu Pro (blue LED flashes).
2.Open EasySense.
3.Go to Devices.
4.Select the Vu Pro shown by its unique ID.
5.LED flashes green when connected.
Do not pair via your device’s Bluetooth settings—EasySense handles connection automatically.
4. View Live Data
On the Vu Pro (stand-alone)
1.Main Menu, Left/Right buttons (◀/▶) choose Meter
2.Press ✓
3.Live sensor readings display immediately
4.External sensors auto-identify in Meter mode
In EasySense
•Open EasySense → Live Data panel
5. Choose A Data Logging Type
A. Continuous Logging
In EasySense
•Open EasySense → Setup, Continuous (set the parameters)
•Press Run and Stop
With Vu Pro: EasyLog
Best for experiments that run over time.
1.Main Menu → EasyLog
2.Press ✓ to enter
3.Press ✓ to start
4.Press X to stop
5.Press ✓ to exit
B. Manual Readings
In EasySense
•Open EasySense → Setup, Snapshot
•Press Run and Stop
With Vu Pro: SnapShot
1.Main Menu, Left/Right buttons (◀/▶) choose Snapshot
2.Press ✓ to enter
3.Press ✓ to take a reading
4.Press X to exit
5.Press ✓ to exit
C. Timing
In EasySense
•Open EasySense → Setup, Timing (set the parameters)
•Press Run and Stop
With Vu Pro: Timing
Timing (speed & time with switches/light gates)
1.Connect the switch/light gate(s)/mat(s) before entering the mode
1.Main Menu, Left/Right buttons (◀/▶) choose Timing
2.Press ✓ to enter
3.Use Up/Down (▲/▼) choose: Time (see speed below)
4.Press ✓ to enter
oTime at A
oTime A to A
oTime A to B
oUse Up/Down (▲/▼) choose type
oPress ✓ to enter
oPress X to exit
1.Use Up/Down (▲/▼) choose: Speed
2.Press ✓ to enter
oSpeed at A (enter distance)
oSpeed A to B (enter distance)
oUse Up/Down (▲/▼) choose type
oPress ✓ to enter
oUse Up/Down (▲/▼) choose Card Width
oPress ✓ to enter
oPress X to exit
oPress ✓ to exit
Vu Pro Connected To EasySense
When connected to a collection station, the Vu Pro is controlled through the EasySense software.
•Always use the latest version of EasySense.
•Ensure the Vu Pro firmware is up to date (check via System → About).
EasySense Software Workflow
1. Devices – Connect & Configure Sensors
Configure each sensor according to your needs.
2. Setup – Define The Experiment Type
Continuous: Collects data at regular sample intervals (similar to EasyLog).
Timing: Synchronizes data collection with Vu Pro timing mode.
Snapshot: Captures single data points like Vu Pro snapshot mode.
3. Run/Stop – Record Data
Run: Start data acquisition to begin recording.
Stop: End the experiment and save the recorded data.
EasySense Data Tools
Axis Tabs (Right & Bottom): Adjust which data is displayed and control the axis ranges for graphs.
Runs Manager: View, manage, and delete recorded runs of experiments.
Tools Menu: Access analysis tools for working with numerical data (e.g., statistics, calculations).
Importing Data
Use File → Import from Device to transfer data stored on the Vu Pro into EasySense.Once imported, you can analyse the data using the full suite of EasySense tools (graphs, charts, numerical analysis)
Vu Pro As A Stand Alone Instrument
The various menu items are now listed and these can be accesses from the Home Screen.
Meter

oDisplays live readings from built-in and plug-in sensors.
oNo data is saved.
oSensors are identified.
•Use the Left/Right buttons (◀/▶) to highlight Meter in the Main Menu.
•Press Enter (✓) to open live data view.
Adjust Sensor Settings
•Press Enter (✓) to open Sensor Settings.
•Use Up/Down (▲/▼) to scroll through available sensors.
•Press Enter (✓) to activate the selected sensor.
Change Range
•Use Right (▶) plus Enter (✓) to move to Range settings.
•Use Up/Down (▲/▼) to select the desired range.
•Press Enter (✓) to confirm.
•Press X to leave Sensor Settings, live data, or return to the Main Menu.
Snapshot

oEnables manual capture of sensor readings.
oA reading is taken each time the ► (enter) button is pressed, not at timed intervals.
oIdeal for recording specific moments or changes on demand.
•Use the Left/Right buttons (◀/▶) to highlight Snapshot in the Main Menu.
•Press Enter (✓) to open live data view. Sensor readings appear immediately on the screen.
•Press Enter (✓) each time you want to capture a reading.
•Press Exit (X) to leave Snapshot mode.
•Press Enter (✓) to confirm and return to the Main Menu.
Pictogram

oUses blocks or bars to visually represent data (0–10 scale).
oEach block equals one-tenth of the sensor's range.
•Use the Left/Right buttons (◀/▶) to highlight Pictogram in the Main Menu.
•Press Enter (✓) to open the mode.
•Use Up/Down (▲/▼) to scroll through the styles; options include Icon, Block, or Bar.
•Press Enter (✓) to confirm your selection.
•Sensor readings are displayed visually as blocks or bars on a 0–10 scale. Each block represents one‑tenth of the sensor’s range.
•Press Exit (X) to leave Pictogram and return to the Main Menu.
Stopwatch

oDisplays time-related sensor data in real time.
oDoes not store any data.
•Use the Left/Right buttons (◀/▶) to highlight Stopwatch in the Main Menu.
•Press Enter (✓) to open the mode.
•Press the Right button (▶) to start or stop the stopwatch.
•Press the Left button (◀) to reset the timer back to zero.
•Press Exit (X) to leave Stopwatch and return to the Main Menu.
System

•Use the Left/Right buttons (◀/▶) to highlight System in the Main Menu.
•Press Enter (✓) to open the System options.
•Available options include:
oLanguage: Change display language
oSwitch Off: Power down the device
oSensor: Enable or disable active sensors
oDelete All Data: Clear stored datasets
oFull Reset: Reset the device to factory settings
oDecimals: Adjust decimal display format
oAbout: View firmware version and system information
Select an Item
•Use Up/Down (▲/▼) to scroll through the options.
•Press Enter (✓) to confirm your selection.
•Use Up/Down (▲/▼) to scroll through the options and Enter (✓) to confirm choices.
•Press Exit (X) to leave the menu.
•Press Exit (X) to leave the System menu and return to the Main Menu
Counting

oCounts events or pulses (e.g., manual input, motion or Light Sensor triggers).
•Use the Left/Right buttons (◀/▶) to highlight Counting in the Main Menu.
•Press Enter (✓) to open the Counting screen.
•Use Up/Down (▲/▼) to count types (A or B).
•Press Enter (✓) to do some maths!
•Press Exit (X) to leave Counting mode.
•Press Enter (✓) to confirm and return to the Main Menu.
Timing

oUsed to set up and store simple time and speed measurements.
oConnect the digital switch type sensors before selecting Timing, assigning them to Input A or B.
oOptions include:
▪Time at A
▪Time from A to A
▪Time A to B
▪Speed at A
▪Speed from A to B
oFor direct speed calculations:
▪For Speed A to B, input the distance between sensors connected to inputs A and B.
▪For Speed at A, input the width of the interrupt card passing through the light gate connected to input A.
oTime values are displayed in milliseconds (ms) on the LCD; press ► (enter) to toggle to seconds.
•Use the Left/Right buttons (◀/▶) to highlight Timing in the Main Menu.
A. Time Measurements
•Choose Time Mode
oUse Up/Down (▲/▼) to scroll and set Time.
oPress Enter (✓) to confirm.
•Select Timing Type
oOptions include:
▪Time at A – measure time at a single sensor.
▪Time A to A – stopwatch mode (start/stop at the same sensor).
▪Time A to B – measure elapsed time between two sensors.
oUse Up/Down (▲/▼) to highlight the desired type.
oPress Enter (✓) to confirm.
•Exit Submenu
oPress Exit (X) to leave the Timing submenu.
oPress Enter (✓) to return to the Main Menu.
B. Speed Measurements
•Choose Speed Mode
oUse Up/Down (▲/▼) to scroll and set Speed.
oPress Enter (✓) to confirm.
•Select Speed Type
oOptions include:
▪Speed at A – measure speed at a single sensor.
▪Speed A to B – measure speed between two sensors.
oUse Up/Down (▲/▼) to highlight the desired type.
oPress Enter (✓) to confirm.
•Enter Parameters
oUse Up/Down (▲/▼) to select and adjust:
▪Card Width (for Speed at A with a light gate).
▪Distance A to B (for Speed A to B).
oPress Enter (✓) to confirm.
•Start Data Collection
oPress Enter (✓) to begin recording.
•Exit Timing Mode
oPress Exit (X) to leave Timing.
EasyLog

oLogs data continuously until manually stopped.
oNo need to set a duration in advance.
oThe bottom line on the LCD shows progress during logging.
oWhen the line fills:
▪Logged samples are compressed.
▪The sample rate may change to optimise memory usage.
▪
•Use the Left/Right buttons (◀/▶) to highlight EasyLog in the Main Menu.
•Press Enter (✓) to open the mode.
•Sensor readings appear immediately on the screen. External sensors are identified in EasyLog mode.
•Press Enter (✓) to begin logging. Progress is shown on the bottom line of the LCD.
•Data is recorded continuously until you stop it with Exit (X).
•Logged samples may be compressed and sample rate adjusted to optimise memory usage.
•Press Enter (✓) to confirm and return to the Main Menu.
Safety Recommendations
1. Small Parts and Accessories
Some accessories supplied with the Vu Pro, such as plug-in sensors, connectors, and USB cables, may contain small components that could present a choking hazard. These items should be kept out of the reach of very young children when not in use. Always ensure that loose parts are stored securely and that children do not handle small accessories without appropriate guidance.
2. Supervision for Young Users
The Vu Pro is designed for use in educational settings, including activities for younger learners. However, particularly those under the age of 8—should be supervised when connecting sensors, attaching accessories, or charging the device. Adult oversight helps ensure safe handling of cables, connectors, and external components, and supports proper use during experiments.
3. Electrical Safety Guidance
The Vu Pro charges using a low-voltage USB power source, but standard electrical safety practices should still be followed. Do not use damaged or frayed USB cables, and disconnect the device immediately if a cable or connector becomes hot or shows signs of wear. Keep all connectors dry and avoid charging or using the device near water or other liquids. Only use USB power supplies that meet the recommended specifications provided in this manual.
4. Educational Use of Heart Sensors
The built-in heart rate sensor and any associated accessories are intended solely for educational demonstrations and simple physiological investigations. They are not medical devices and must not be used for health assessment, diagnosis, or monitoring of medical conditions