
5.2.11 Multi-Scale
The scale involved with multi sensor acquisition can vary a lot. For example sound levels may not vary as much as light and their baseline units are considerably different.
The option produces an optimised representation of the data. The Min and Max scales and baseline values are used to produce the best scaled fit so that the data can be shown on a common scale.
The Multi-scale is used to represent the data, optimally displayed to see variations. The Y-axis tab can then be used to define (Min-Max), and the "engaged" reading is used to provide a unit scale for display.
An example is given below.
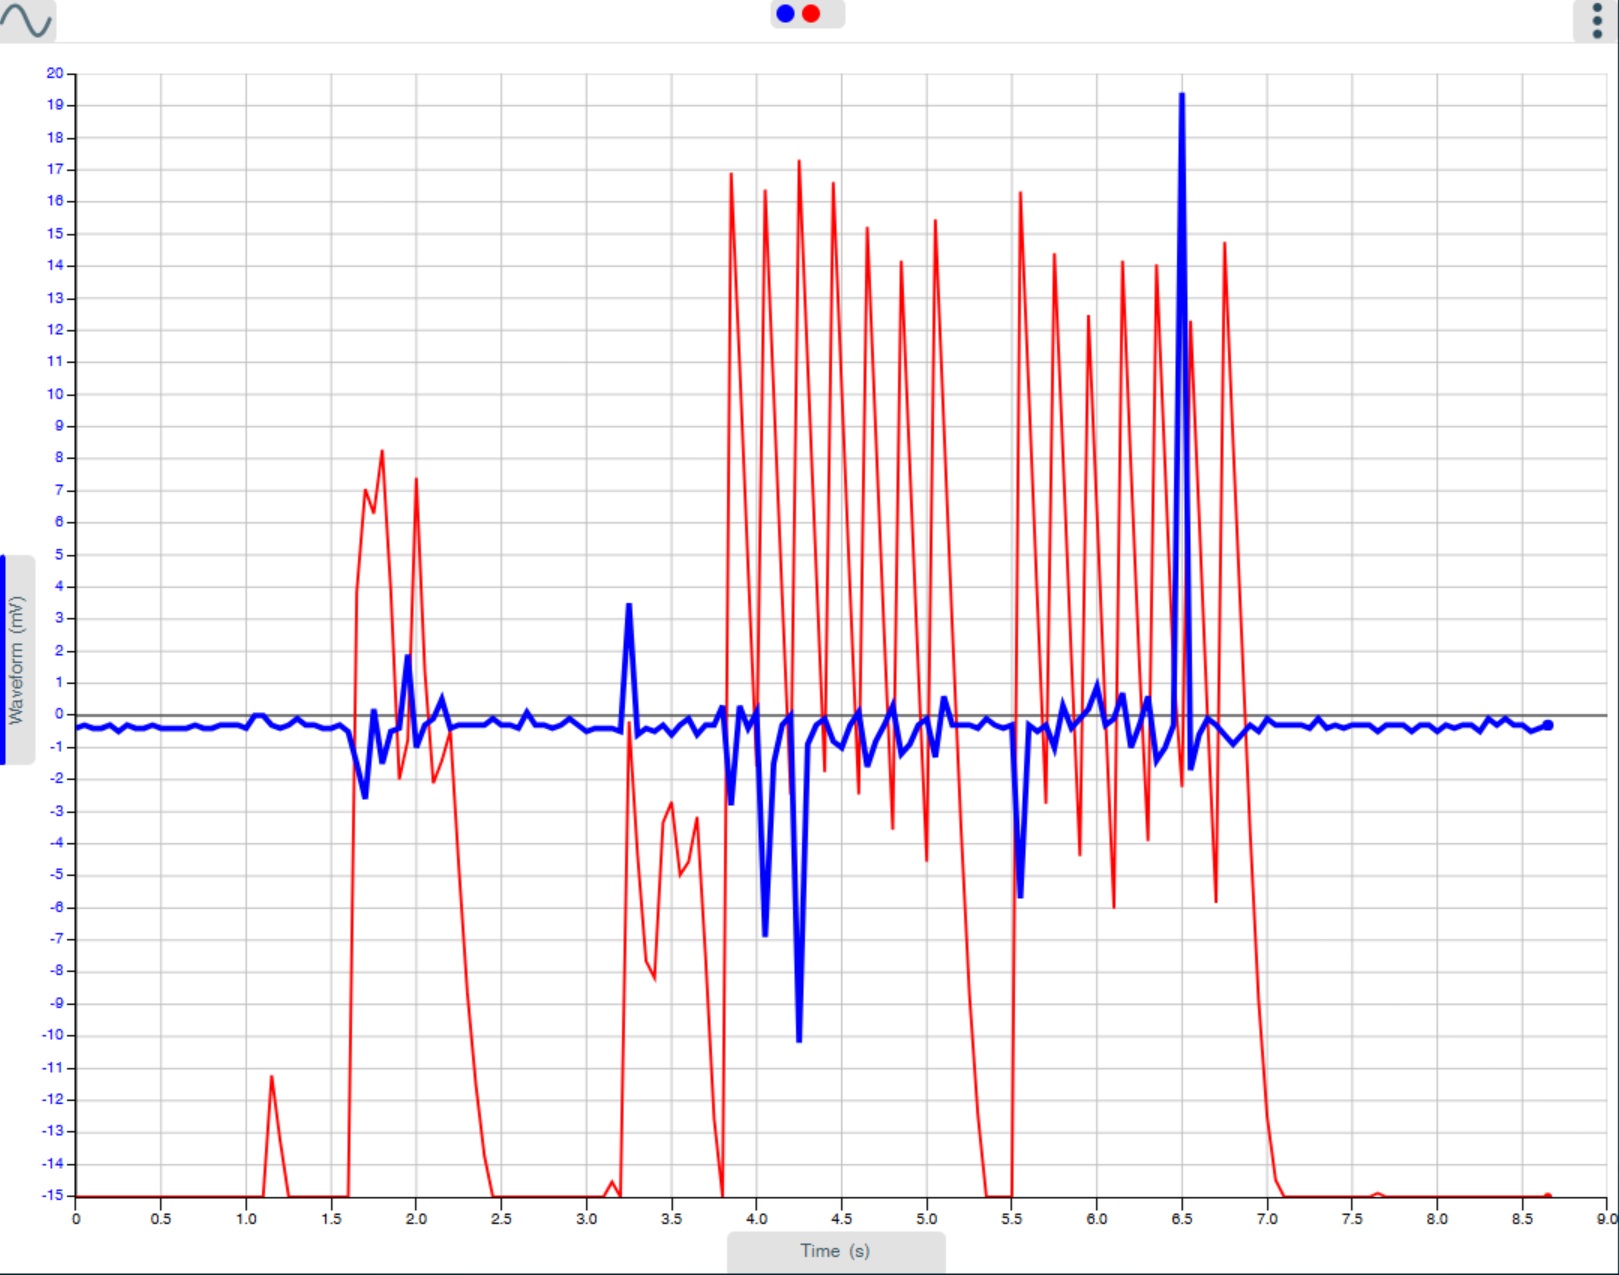
Here waveform and sound level are displayed Min-max, but the Y-axis is defined as waveform.