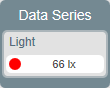
The colour circle in a data series box corresponds to the colour of the plotted line.
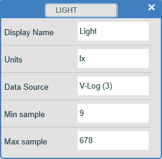
Tap or click on a box to view information about the data collected from a sensor or derived data e.g. name, units, source and the highest or lowest value sample recorded.