
5.3.4 Axis Display Options
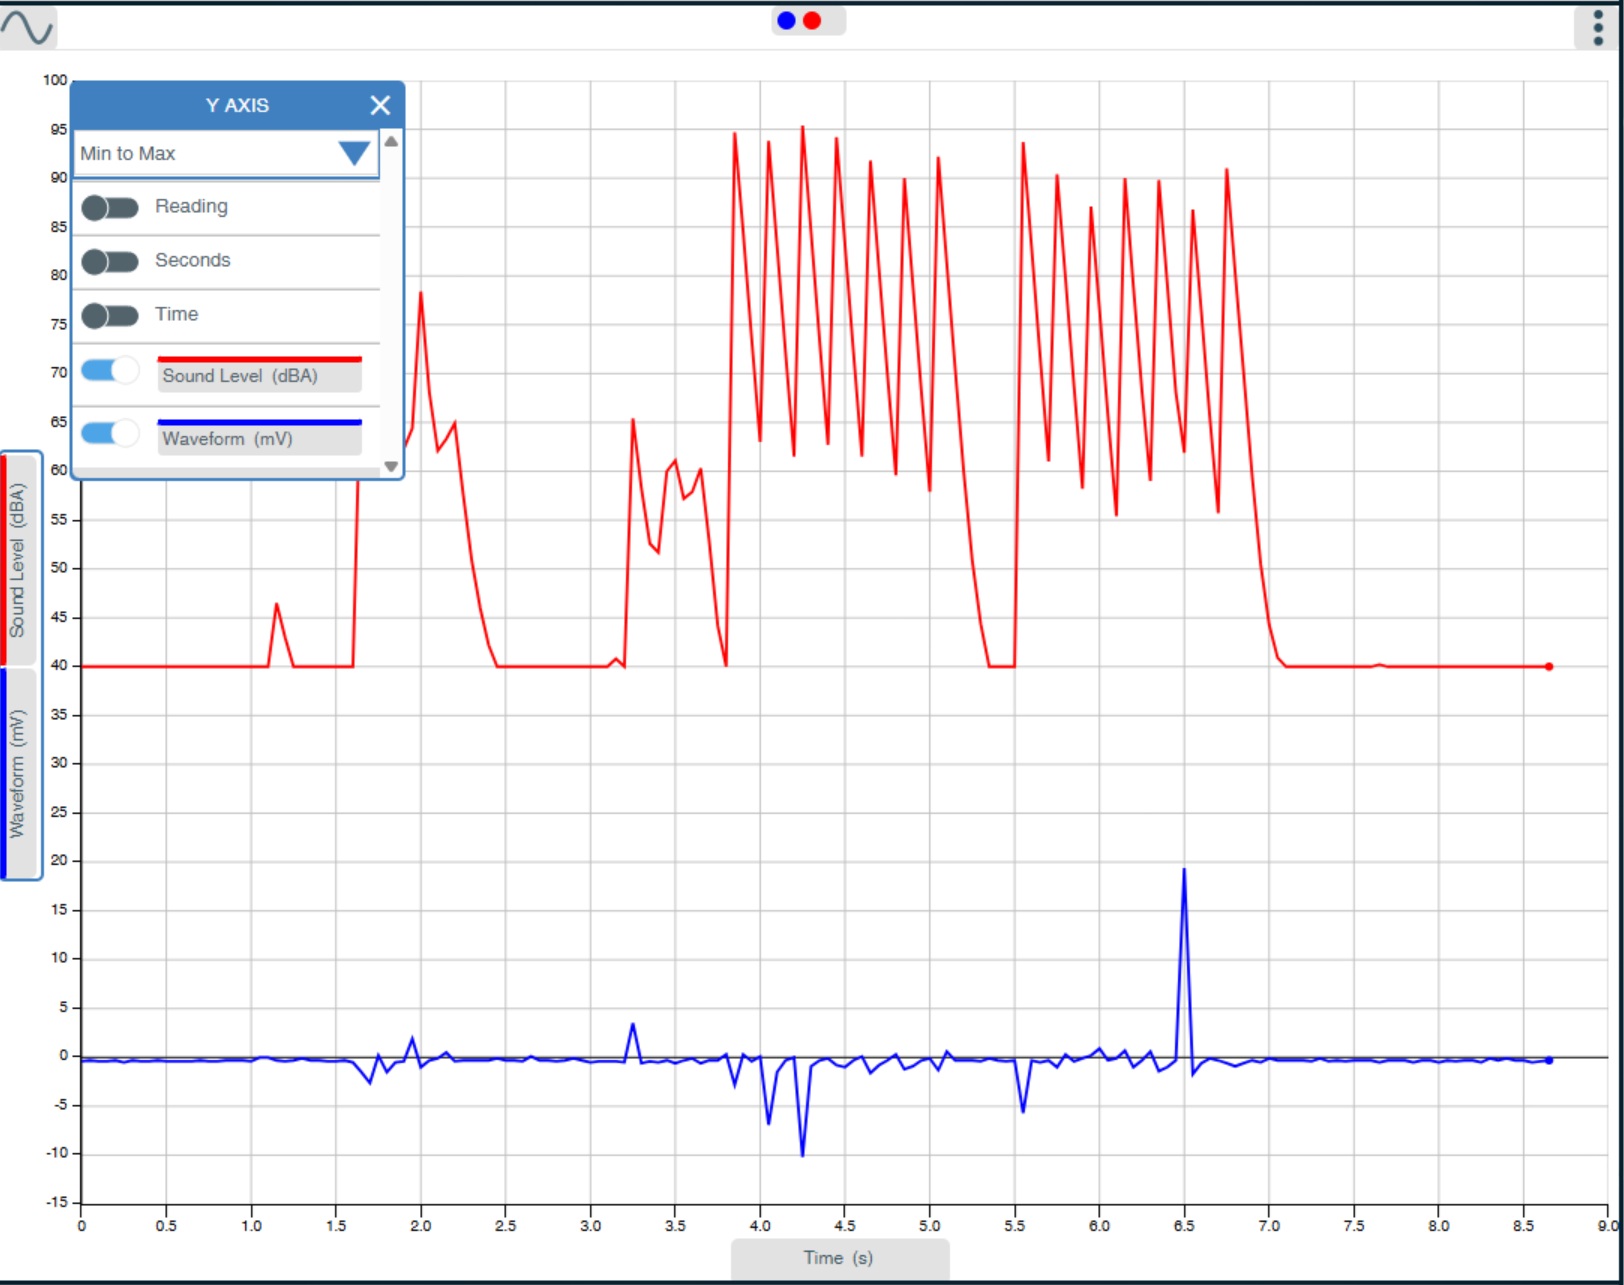
Tap or click outside the graph area to open the X or Y-axis options. Note that each axis can display the following items.
Tap or click in this area for Y- axis options.
Tap or click in this area for X -axis options.
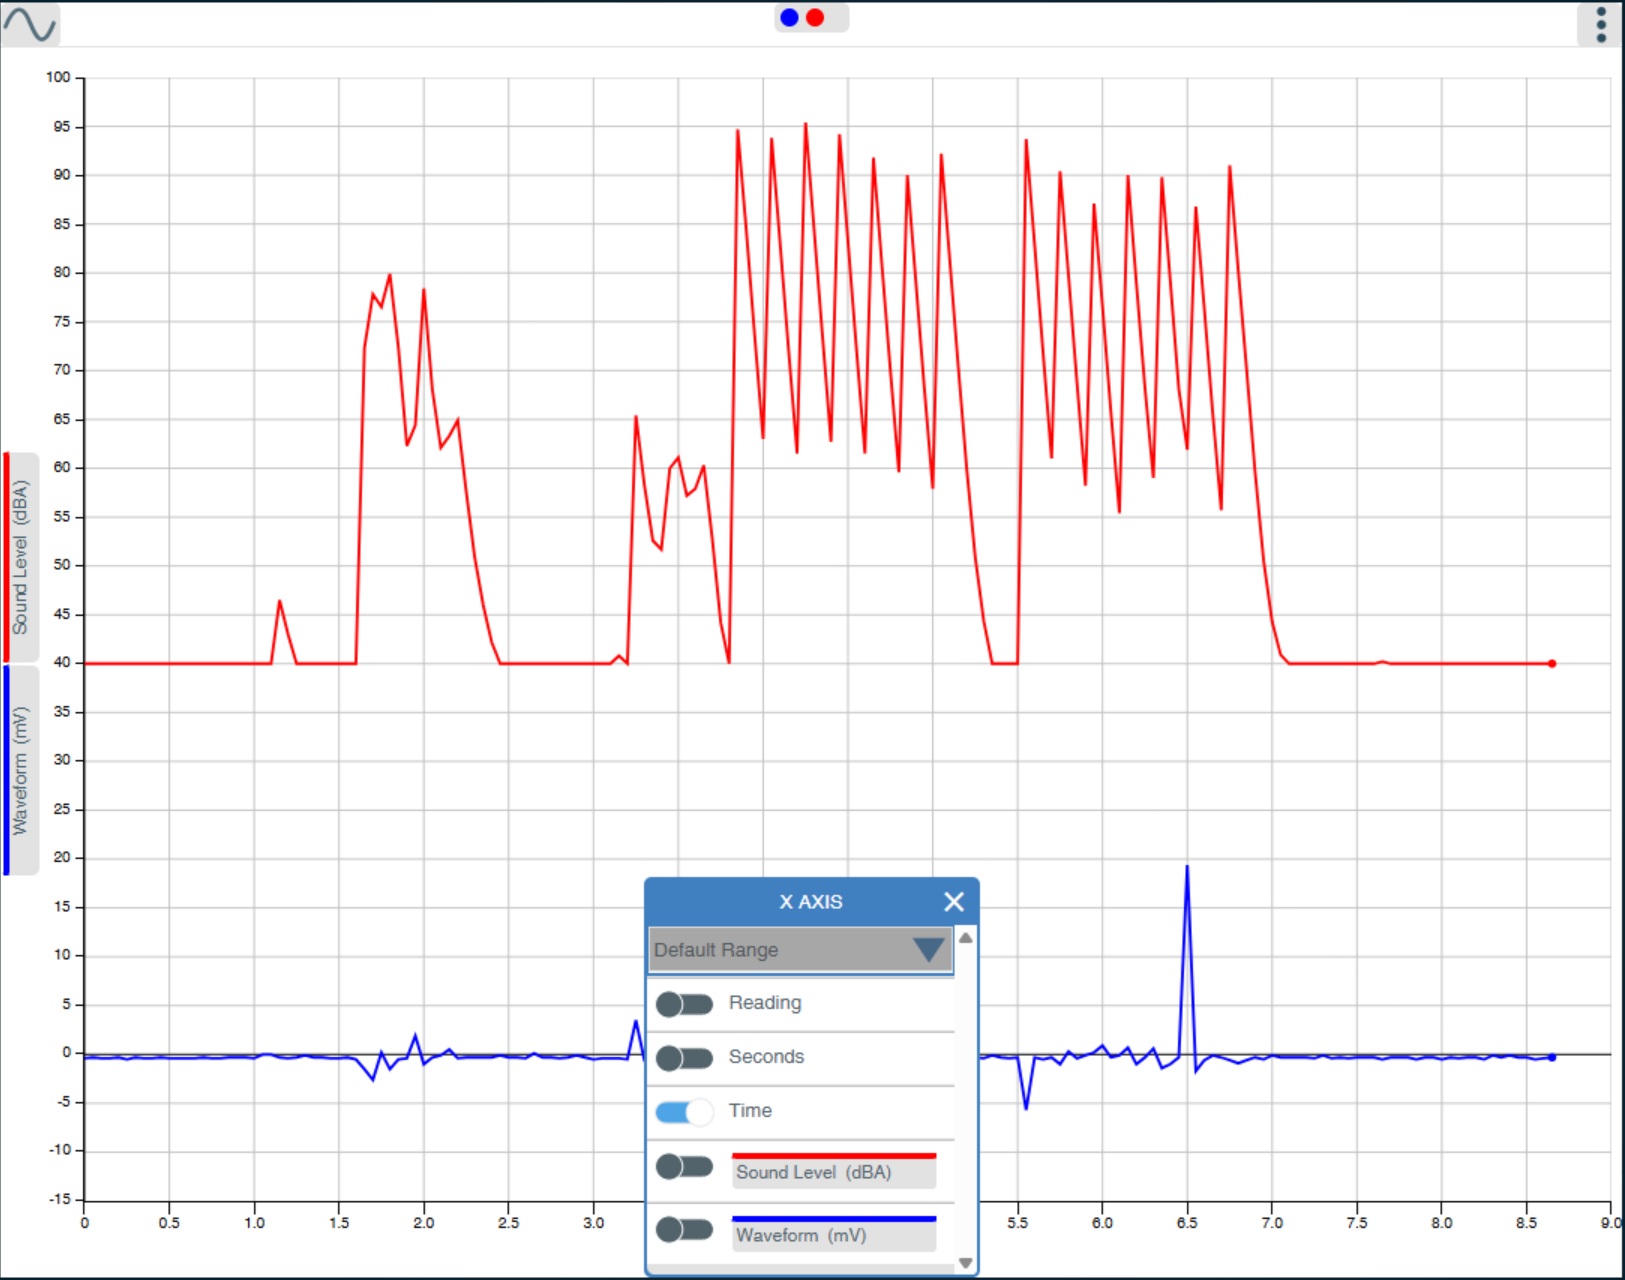
From this tab select whether you would like Time, Reading Number, or a Data Series (e.g., sensor) displayed on the axis.
Reading Number - set to the number of single readings taken, without any regular time interval between This axis is often used for Snapshot data.
Seconds – from zero until that point in seconds [Time (s)].
Time - Elapsed Time in days, hours, minutes, and seconds.
All Series – from zero to the maximum recorded data of all series or sensors. The axis will adjust automatically while data is being recorded.
Data Series – select from the available sensors.