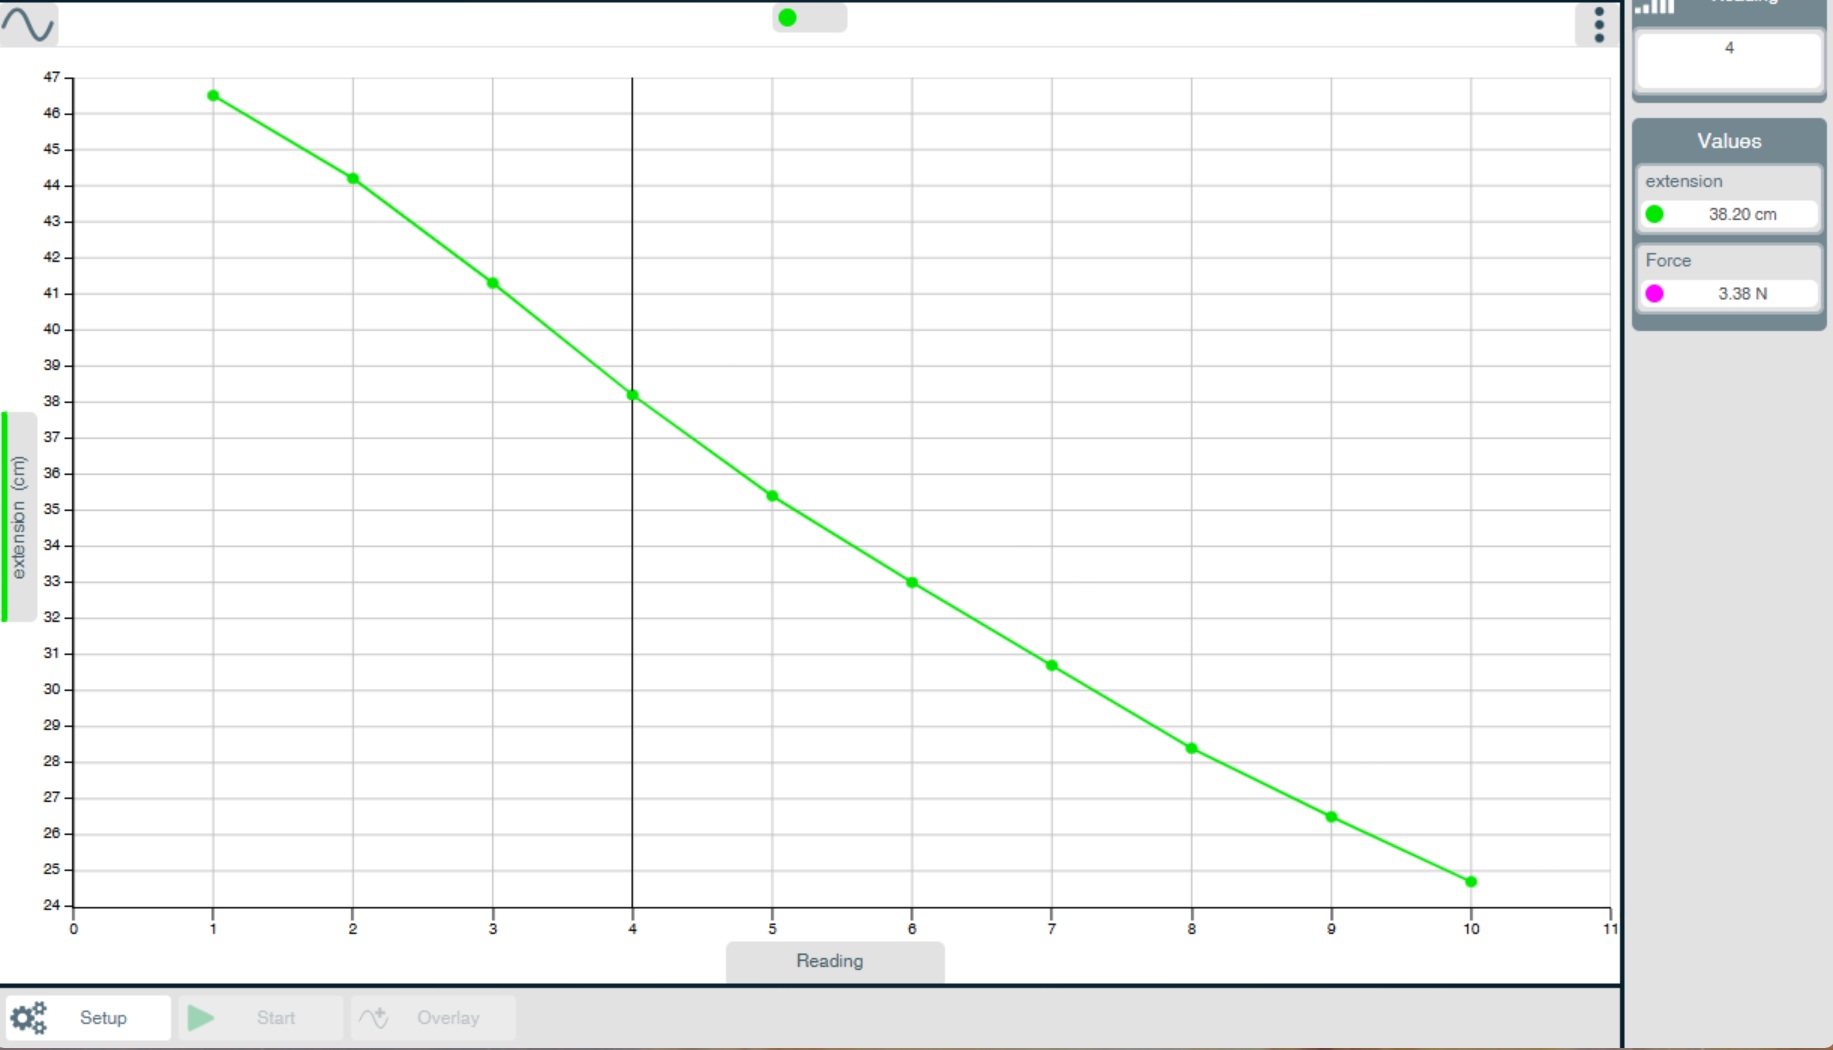
6.4.1 Values
Tap or click on the slide switch to select Values. Tap or click in the graph or table chart at the point of interest. A cursor line will appear on the graph, will highlight in the table. Values will be shown in the values box or numeric chart. The display mode box will indicate the time or reading number of the selected data point. The cursor can be dragged to any point in the range. To deselect, use the Tools icon and tap or click on Values.
Note: If the X-axis is a sensor, select Crosshair instead of Values to indicate what the value from the sensors would be if they crossed at the cursor point.