
6.4.2 Difference
Select Difference, and two cursor lines will appear in the graph area. Move one cursor line to the first reading to be used for the comparison and the other line to the second point. Data in between will be highlighted in a table and the values in the data series box will be the difference between the data at the two points.
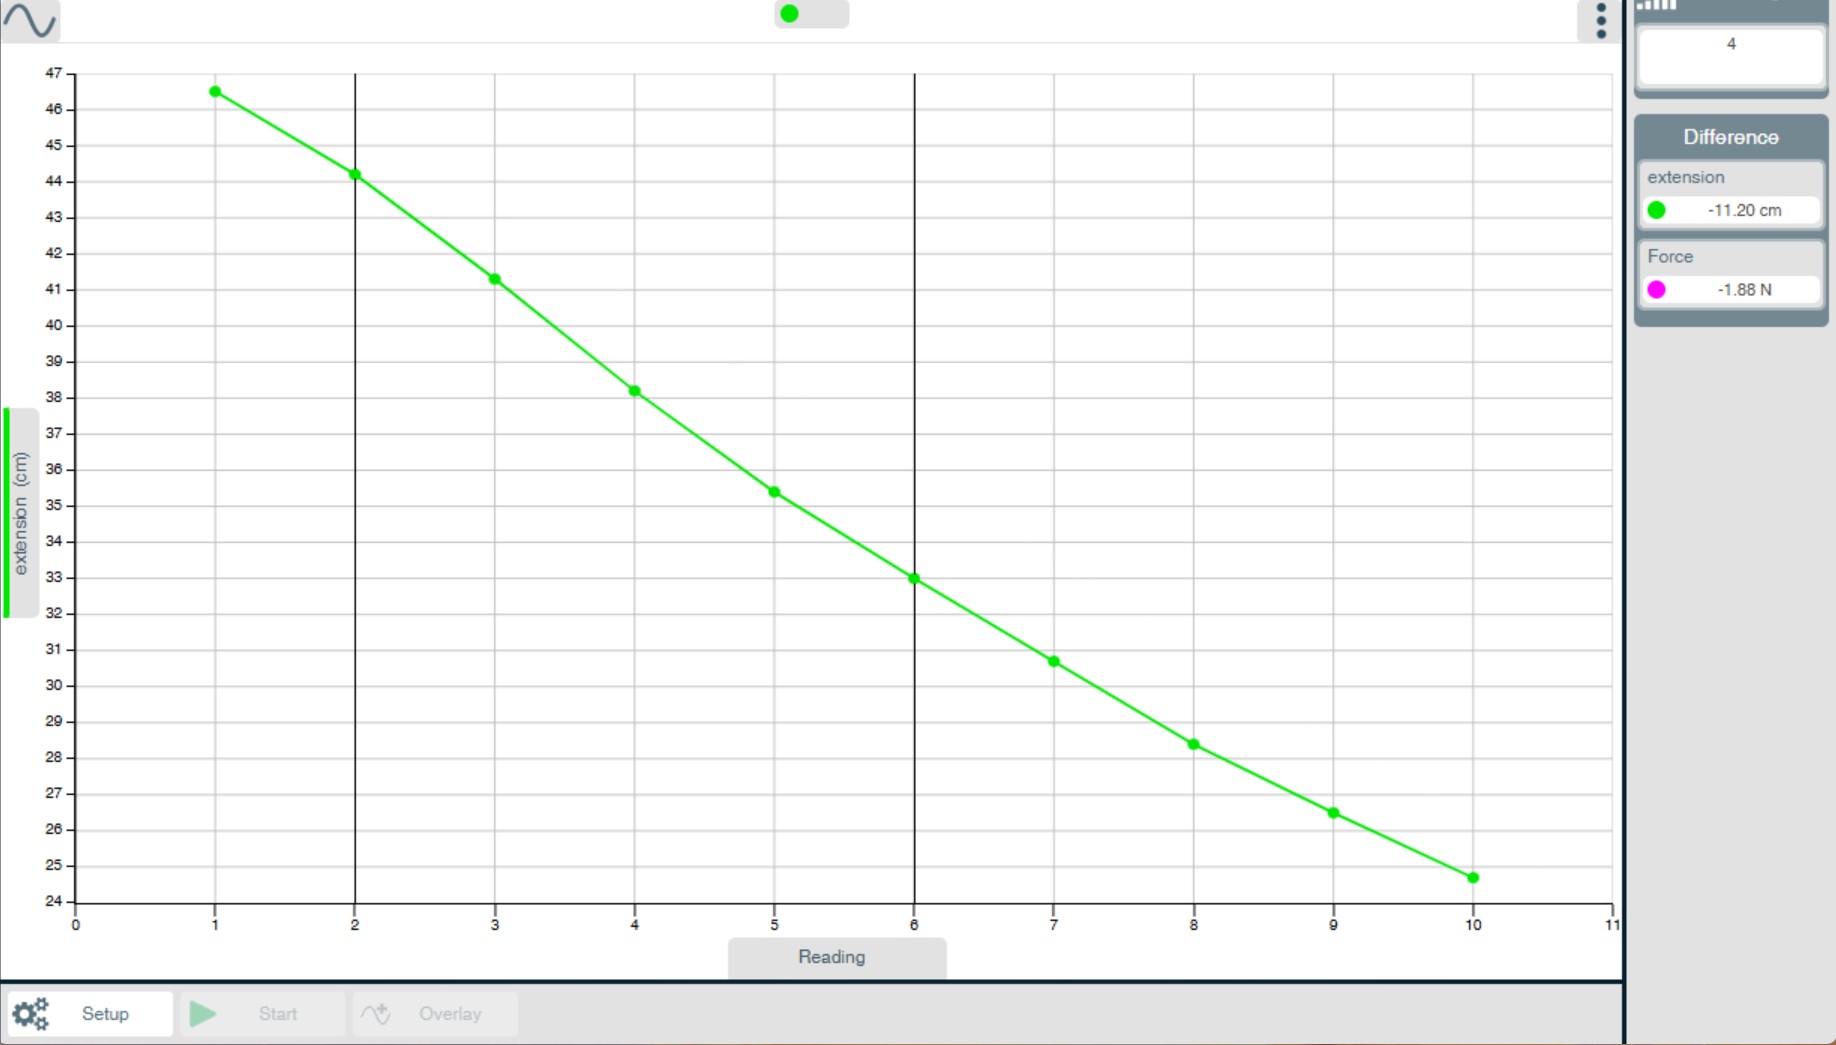
Difference between the data at these two points is shown here.