
6.4.3 Gradient
This feature calculates the rate of change of the data set measured by the cursor positions. When the graph line is horizontal the gradient is zero and values are not changing. A positive gradient shows that values are increasing – the larger the gradient, the faster the change.
Select Gradient, move the two vertical cursors to the position from which information is needed, a dashed line will show the slope of the graph for each data series. The gradient value between the two cursors will be shown in the data series boxes.
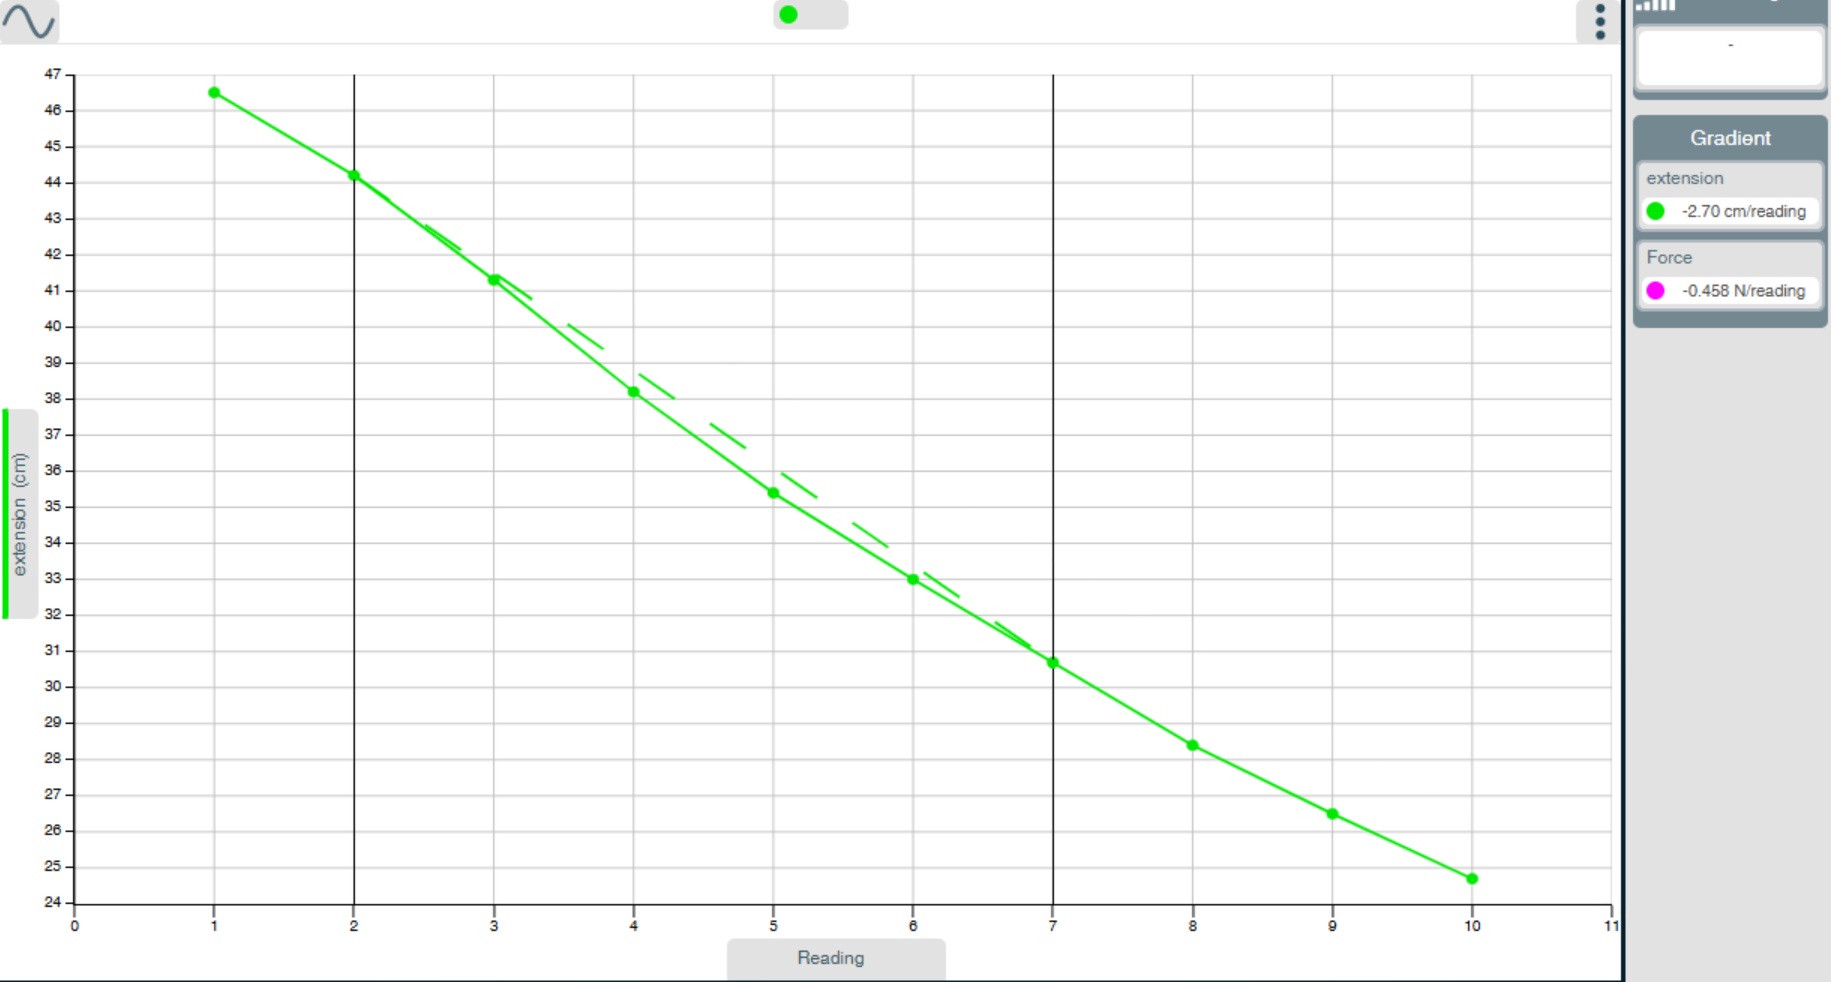
To deselect use the Tools icon and tap or click on Gradient again.