
6.4.4 Area
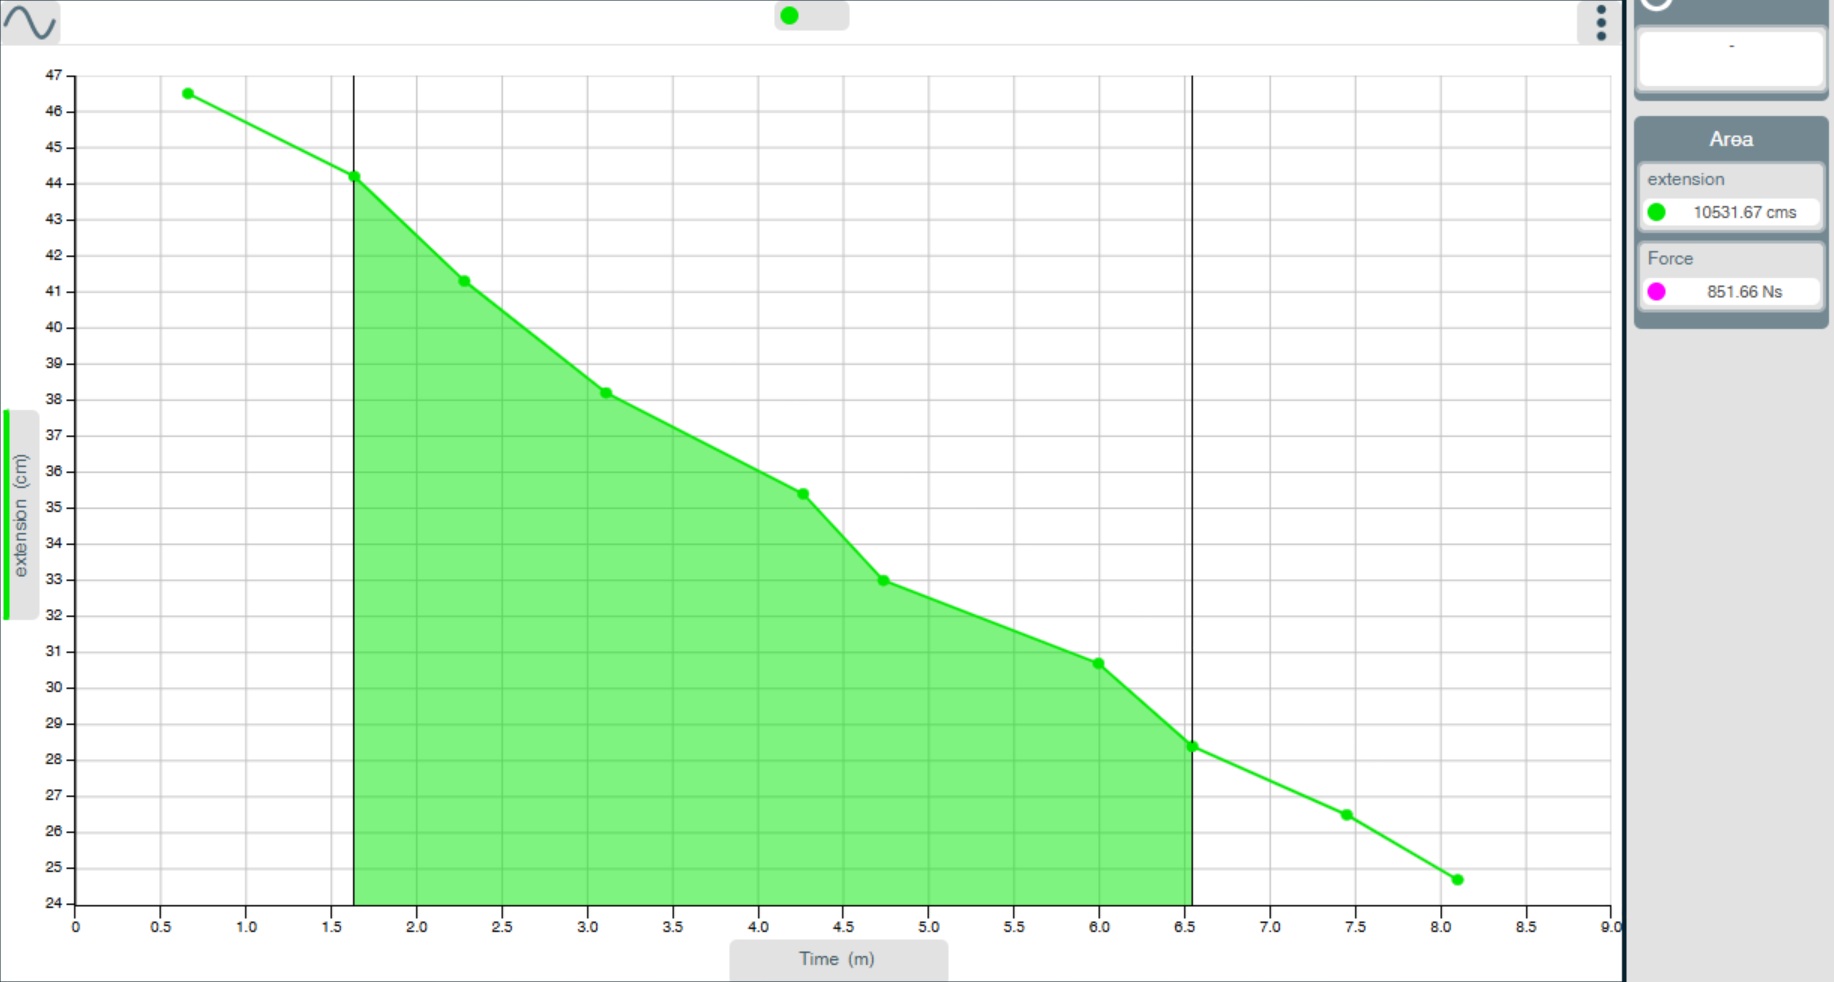
From the Tools icon select Area, move the two vertical cursor lines to the start and end points needed. Shading lines will mark the section under the graph for each data series. The values for area will be shown in the data series boxes.
To de-select, access the Tools icon and tap or click on Area.